

CoreWeave reported $35.6 billion of indebtedness at June 30, 2026, while IREN disclosed $15 billion of remaining planned fiscal 2027 capital spending on November 5, including $6 billion of financing it still aims to secure. Nebius has arranged a $3.5 billion short-term credit facility, and Applied Digital is spending billions to construct AI facilities. The common issue is not a shortage of customer announcements. It is the timing gap between paying for infrastructure and collecting the cash those contracts could generate. Sources: CoreWeave’s SEC filing, IREN’s results and Nebius’s financing announcement.
These disclosures do not establish an industrywide debt crisis or imminent defaults. They do show a capital-intensive sector in which attractive backlogs can coexist with substantial funding needs. Investors should separate liquidity available today, debt already outstanding, unfunded construction commitments and revenue that depends on future delivery.
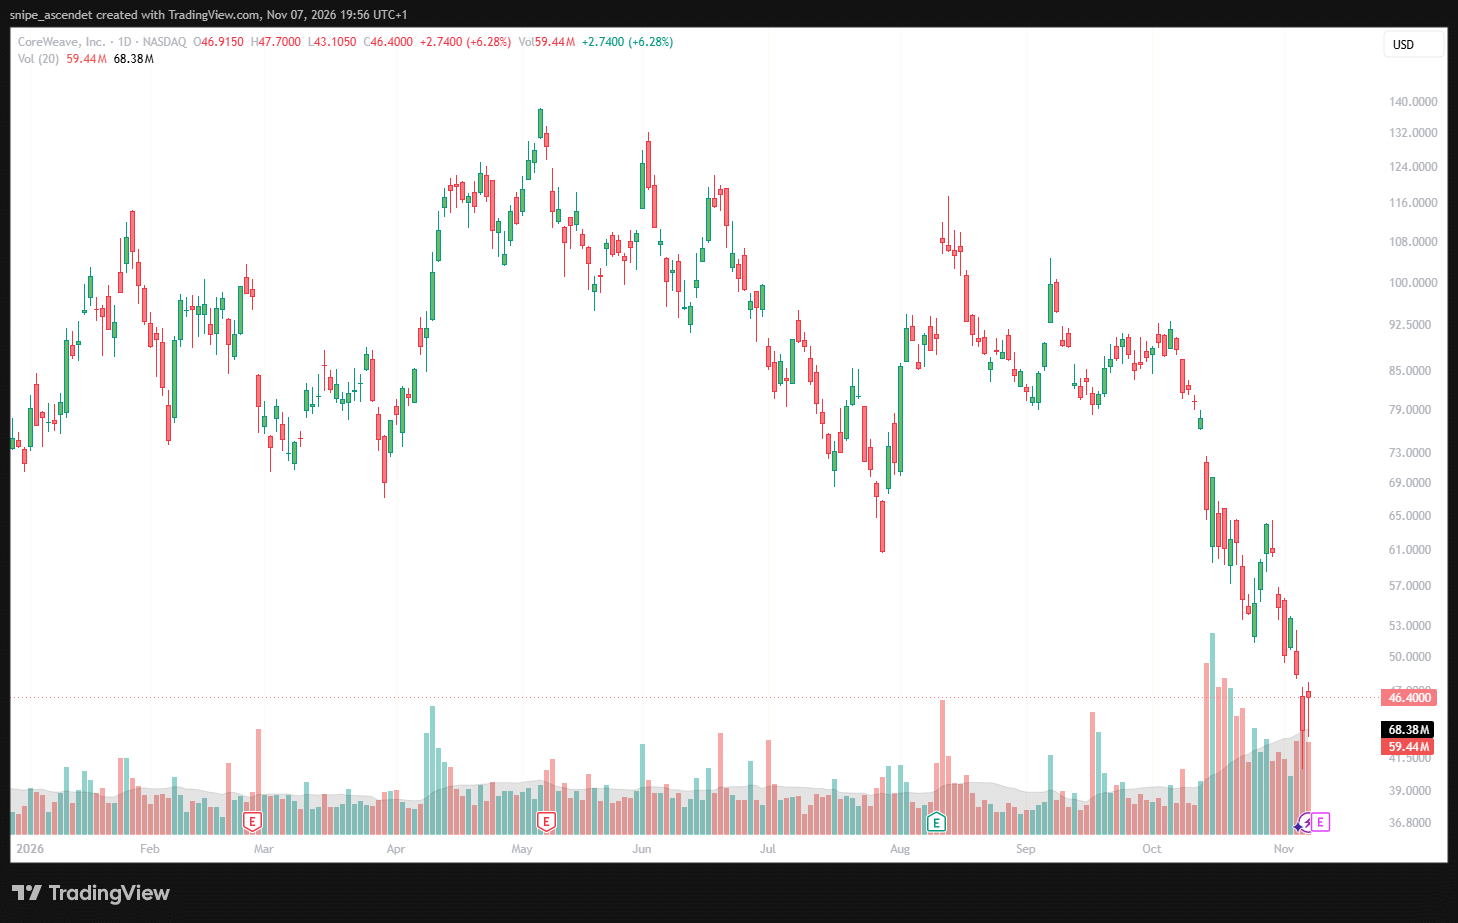
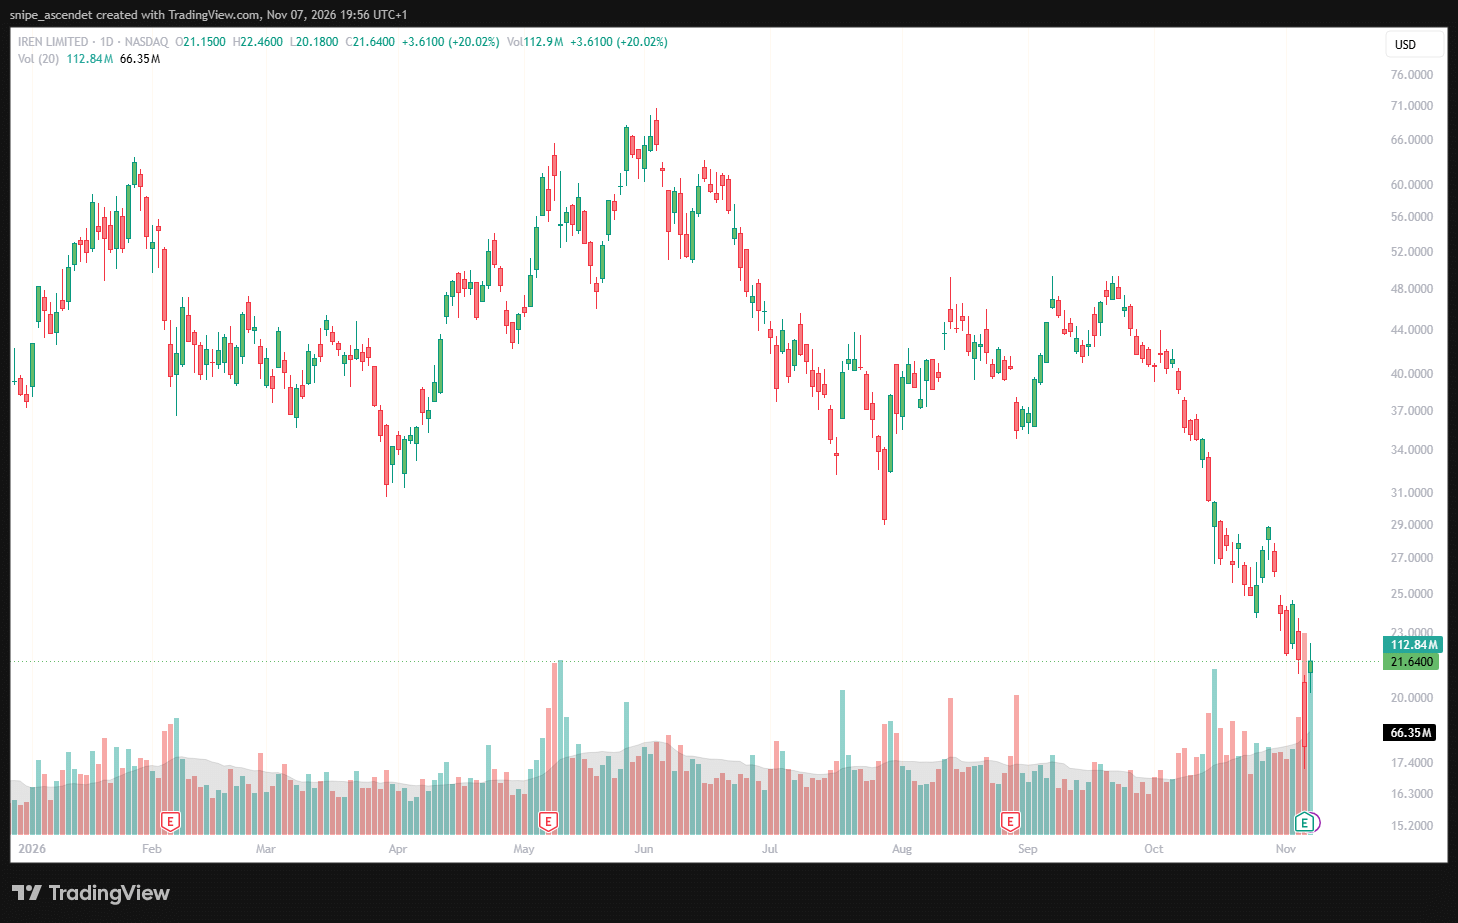
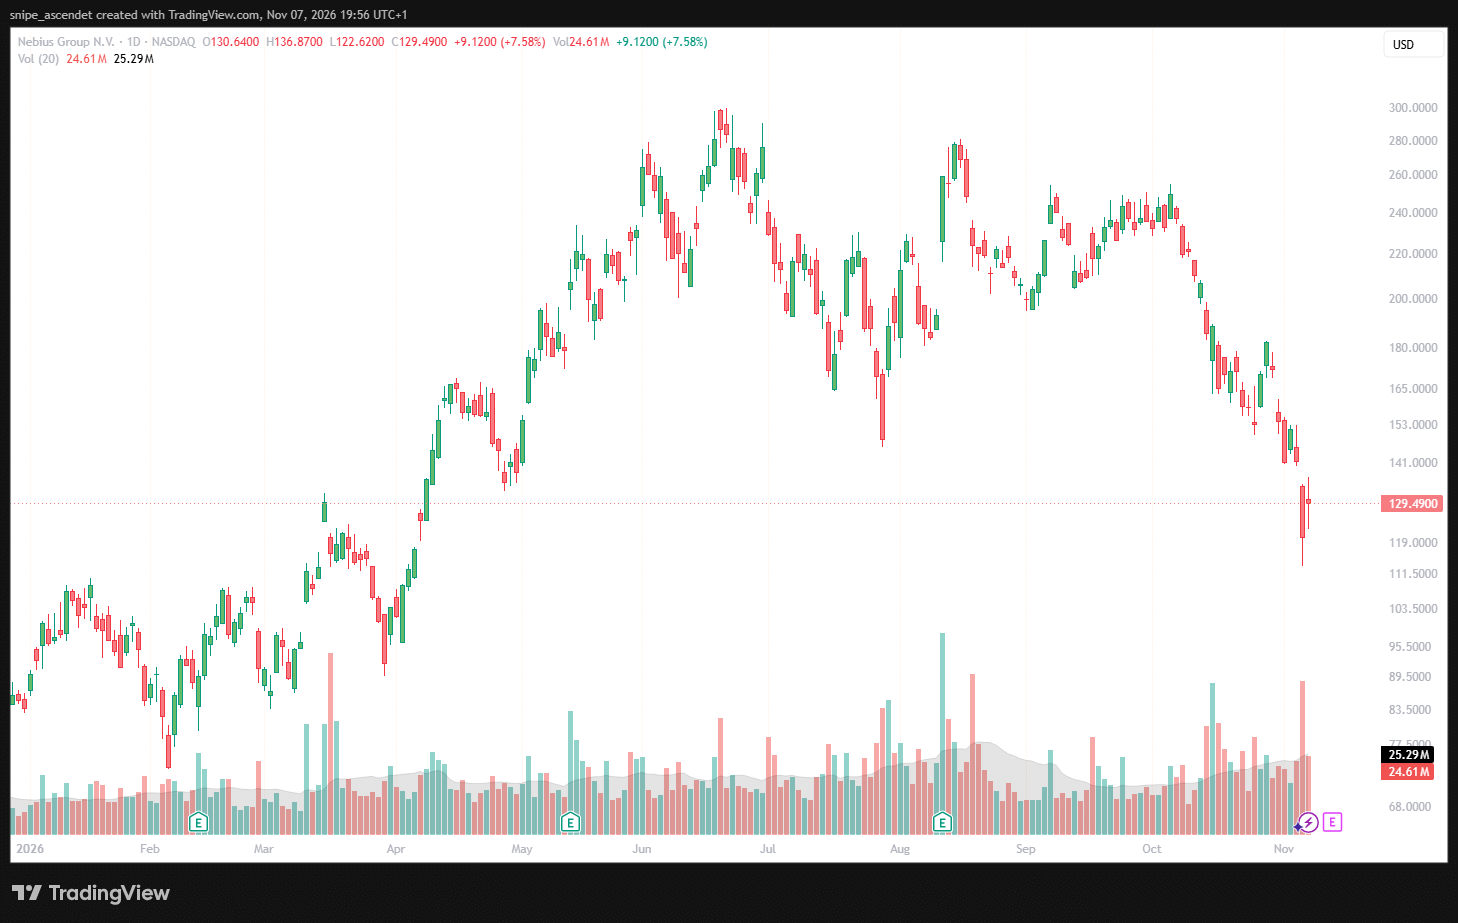
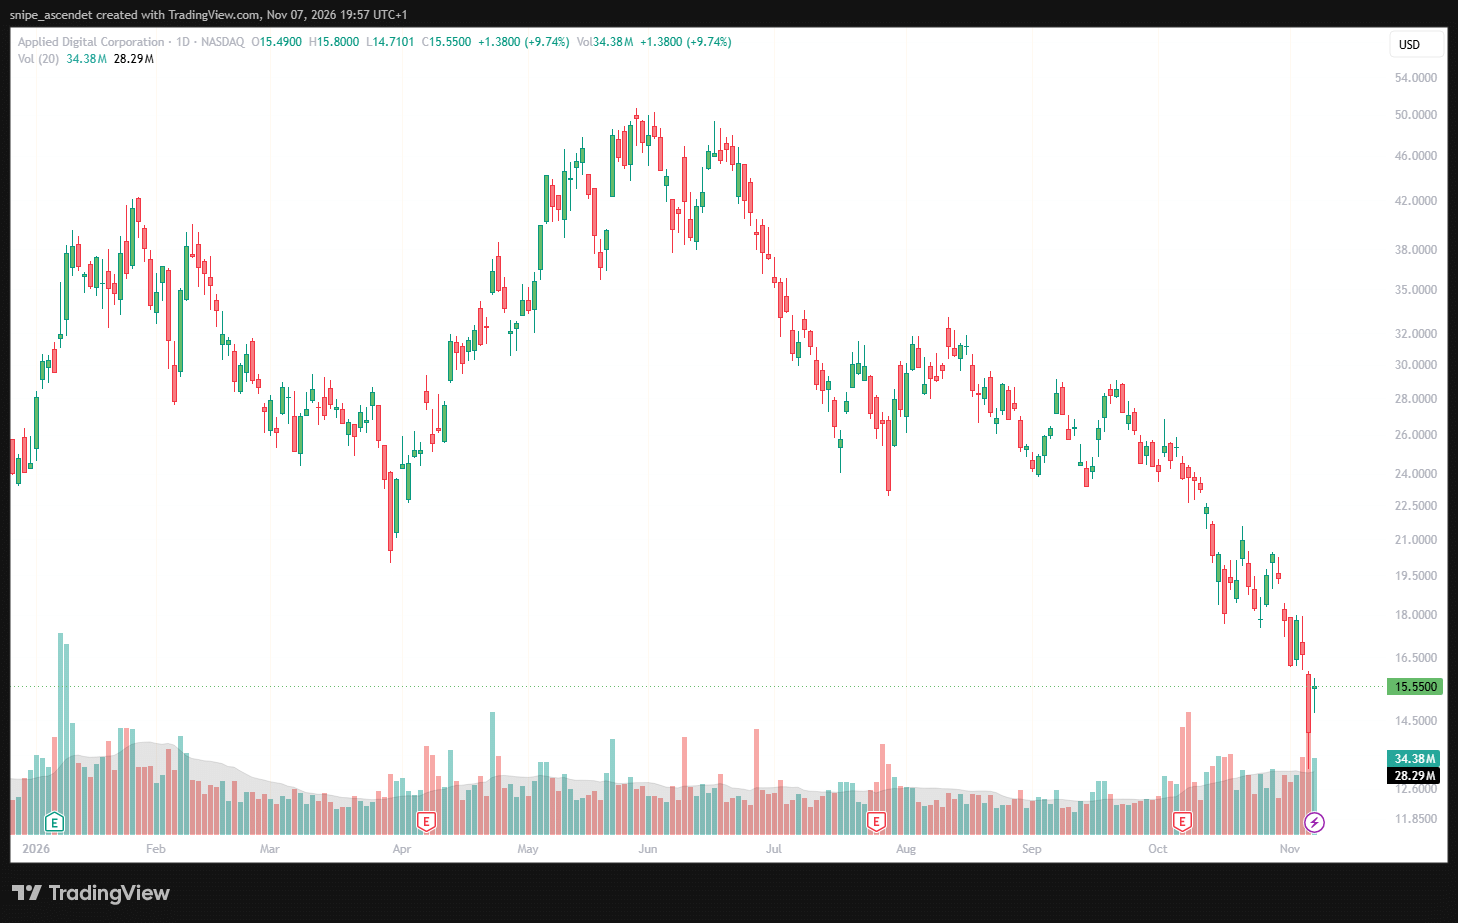
The November 6 market rebound did not resolve that uncertainty. All four stocks rose on Friday, but their daily charts show that the late-October and early-November decline had left the group well below earlier 2026 trading levels. Daily price moves are evidence of repricing, not proof that a loan covenant has been breached.
The financing trap: contracted AI revenue is not cash in the bank
An AI cloud provider may sign a multiyear contract, finance GPUs and data centers upfront, recognize revenue only as capacity becomes available and receive cash on a different schedule. A landlord such as Applied Digital often carries construction and project debt before a tenant starts paying rent. These models are not identical, and a headline backlog figure cannot be used interchangeably with cash, annual recurring revenue or operating profit.
Customer prepayments can improve near-term liquidity, but they also create deferred-revenue obligations. Secured project borrowing can match a particular site or customer agreement, but it exposes lenders and equity holders to collateral values, construction timing and potential refinancing costs. The essential distinction is whether a company can fund its next delivery milestone without relying on uninterrupted access to new capital.
CoreWeave: the clearest test of debt-service capacity
CoreWeave generated $2.575 billion of second-quarter revenue, more than double a year earlier, and reported approximately $104 billion of revenue backlog as of June 30. Its definition includes contracted amounts expected to become revenue if service and delivery conditions are satisfied; it is not unrestricted cash. Net interest expense reached $640 million in that quarter, compared with a GAAP net loss of $626 million. See its second-quarter earnings release.
The June 2026 Form 10-Q describes $35.6 billion of total indebtedness, $5.524 billion of cash and $10.014 billion of undrawn facility availability. That committed borrowing capacity is useful liquidity but is not the same as cash already held. The filing scheduled $4.413 billion of principal payments for the remainder of 2026 and $6.184 billion for 2027, as measured at June 30; repayments and new financings can subsequently change the schedule.
Cash conversion is the second concern. During the first six months of 2026, operating cash inflow was $3.663 billion, but investing cash outflow was $14.874 billion. The difference illustrates how fast CoreWeave is reinvesting relative to its internally generated cash, even though investing cash flow is not identical to a standardized free-cash-flow calculation. Financing inflows supplied much of the gap.
There is a credible upside case: more infrastructure comes online, revenue ramps under existing contracts and the cash needed per additional dollar of sales falls. The downside is that high interest costs remain while GPU delivery, utilization or customer expansion slips. Customer concentration adds exposure: the filing identifies Microsoft, OpenAI and Jane Street among its significant customer relationships. A previous DualFinances analysis examined the CoreWeave valuation debate; the question here is narrower, centered on the timing and price of capital.
IREN: $20.3 billion in backlog, but a $6 billion funding target remains
IREN has moved rapidly toward AI cloud services. For the quarter ended September 30, it reported $228 million of revenue, including $200 million of AI cloud revenue, and a GAAP net loss of $263 million. Backlog reached $20.3 billion, according to its November 5 earnings release. Management said more than $4 billion of targeted annual recurring revenue is contracted and funded, with deployment targeted for January 2027 and potentially stretching into February.
That funded ARR target is not the same as funding the full expansion pipeline. IREN expects about $15 billion of remaining planned fiscal 2027 capital expenditures, with $9 billion covered by cash and committed GPU financing or customer prepayments. Another $6 billion is targeted from potential financing and related sources, subject to market conditions and to capacity ambitions beyond the funded phase. Treat the amount as a disclosed funding plan, not a missed debt payment or a fixed, currently overdue obligation.
At September 30, IREN reported $10.208 billion of balance-sheet debt including finance leases, $3.522 billion of unrestricted cash and additional restricted cash. Its company-defined net debt of $4.430 billion subtracts restricted cash, although those funds are subject to contractual withdrawal limits. This is why the headline net-debt number should not be read as fully deployable liquidity.
The quarter generated $529 million of operating cash, while property, equipment and computer-hardware payments totaled about $4.824 billion. Operating cash benefited from a $645 million increase in deferred revenue. Customer prepayments can reduce the need for equity issuance, but the company still owes the computing services behind those payments. The bullish question is whether contracted deployments start on schedule; the bearish question is what happens if funding markets tighten before the next wave of GPUs is installed.
Nebius: liquidity cushion meets a 364-day refinancing clock
Nebius reported $582.3 million of second-quarter revenue and $236.2 million of adjusted EBITDA for the quarter ended June 30. Its financial statements listed $8.042 billion of cash and cash equivalents and approximately $8.546 billion of current and noncurrent debt. The simple difference is roughly $0.5 billion of net debt, excluding operating leases, but this historical snapshot predates later financing transactions.
Cash-flow details are more revealing than that difference alone. In Q2, cash from operations totaled $2.246 billion, partly supported by a $1.197 billion rise in deferred revenue. Purchases of property, equipment and intangibles were $5.657 billion. Nebius was therefore generating operating cash while investing substantially more into new capacity.
On October 22, Nebius announced a $3.5 billion senior secured Citi facility with a 364-day maturity and initial pricing of Term SOFR plus 2.75%, with the spread able to increase to 3.50%, subject to adjustments. The facility offers capacity to fund development and GPU procurement, but the announcement alone does not demonstrate that the entire amount had been drawn. Its short tenor makes repayment, extension or longer-term replacement a clear 2027 checkpoint.
Customer support is substantial. Nebius announced a five-year Meta arrangement comprising $12 billion of dedicated capacity plus up to $15 billion of additional capacity subject to the agreement structure. The latter should not be presented as an unconditional incremental $15 billion cash payment. The Meta agreement provides demand visibility, while placing a premium on completing the specified clusters and securing durable funding beyond the bridge period.
Applied Digital: leases lower demand risk, not construction risk
Applied Digital has a different model: it builds high-density facilities and leases critical IT capacity to tenants, rather than primarily renting its own GPUs. The company reported $341.9 million of revenue for the fiscal quarter ended August 31 and a $221 million GAAP loss attributable to common stockholders from continuing operations. Its October 7 earnings statement reported approximately $6.4 billion of debt and $3.7 billion in cash including restricted balances. Unrestricted cash and equivalents were about $2.950 billion.
During the quarter, cash provided by operations was $63.9 million, while purchases of property, equipment and other assets consumed $2.075 billion. These are the economics of large construction projects before contracted rental payments reach maturity. The company also disclosed a $1.59 billion issue of 7% secured notes due 2031, an example of replacing shorter-term financing with longer-duration debt tied to a project.
Applied Digital had roughly $36.2 billion of base-term contracted lease revenue covering 1,410 MW across five campuses as of May 31. Its annual filing specifies that Polaris Forge 1 is leased to CoreWeave for approximately $11 billion over the initial 15-year term. A separate Delta Forge 2 agreement adds $5.2 billion in initial-term revenue with an investment-grade hyperscaler. Lease totals spread over 15 years should never be compared with a single quarter of revenue as if they were immediately collectible.
The important cross-company finding is that CoreWeave is both a heavily indebted cloud operator and a major Applied Digital tenant. The companies are not independent risk exposures. A problem funding or utilizing a CoreWeave deployment could affect its own credit profile and the timing or economics of Applied Digital rental cash flows. Contract protections and other high-quality tenants mitigate this risk but do not eliminate it.
What the stock charts and Treasury yield indicate
The supplied daily TradingView charts show November 6 closing prices of $46.40 for CRWV (+6.28%), $21.64 for IREN (+20.02%), $129.49 for NBIS (+7.58%), and $15.55 for APLD (+9.74%). IREN traded about 112.84 million shares, versus its charted 20-day average near 66.35 million, indicating an unusually active rebound session after its November 5 report. These are Friday session figures, not prices from Saturday, November 7.
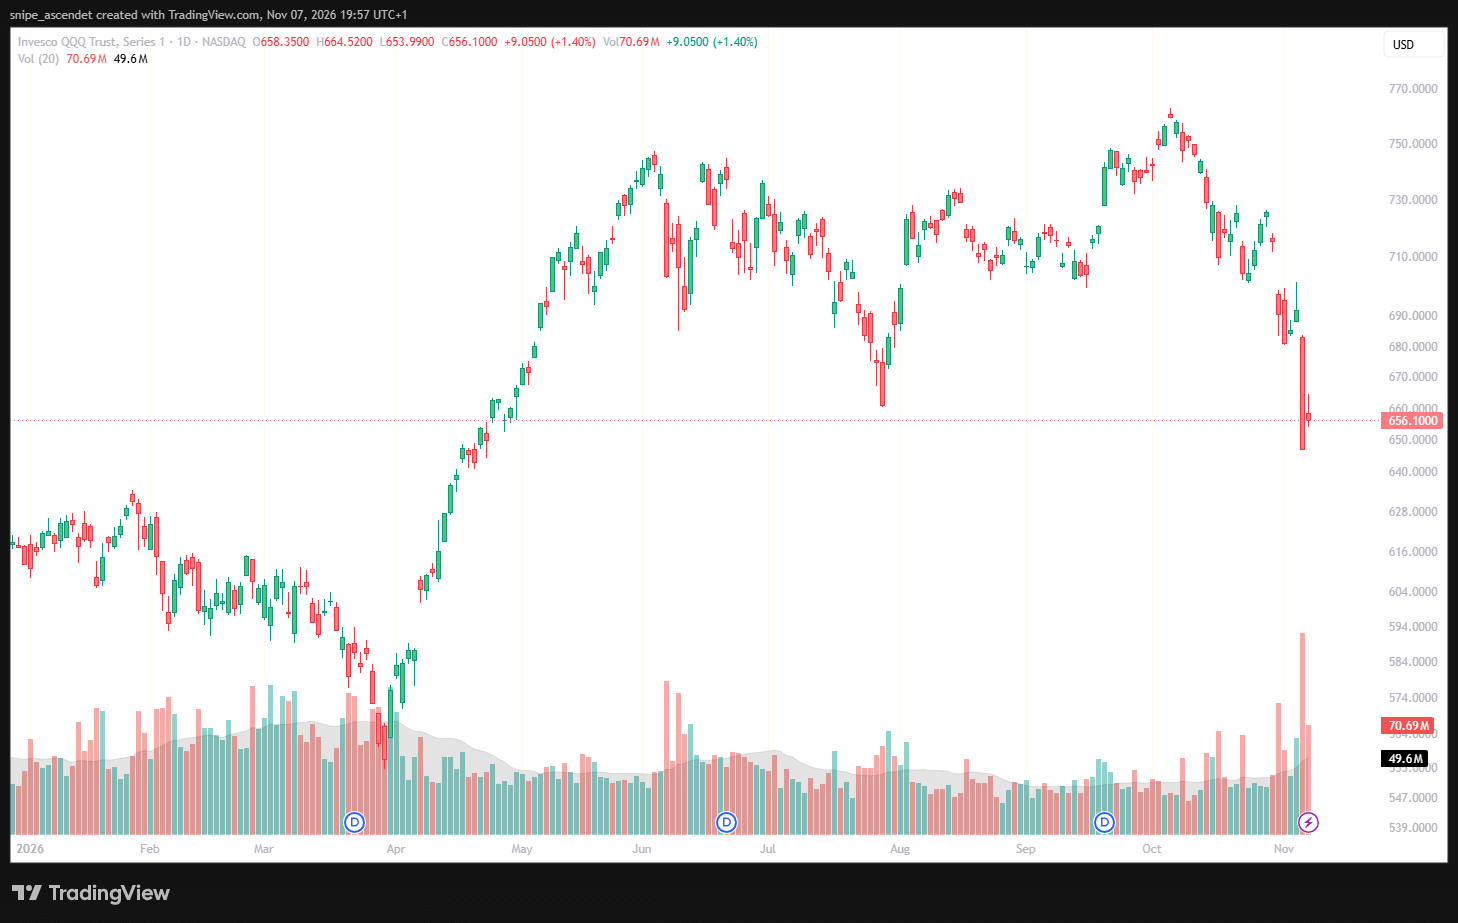
QQQ closed at $656.10, up 1.40%, on the same supplied daily chart. The four stocks rose more sharply than the broad Nasdaq-100 proxy that session, but their charts also show much larger declines over preceding weeks. Since the images cover 2026 rather than a precisely selected August-to-November window, no exact multimonth relative-return claim is made from visual inspection alone. The site’s recent coverage of the Nasdaq rebound gives the broader market context.
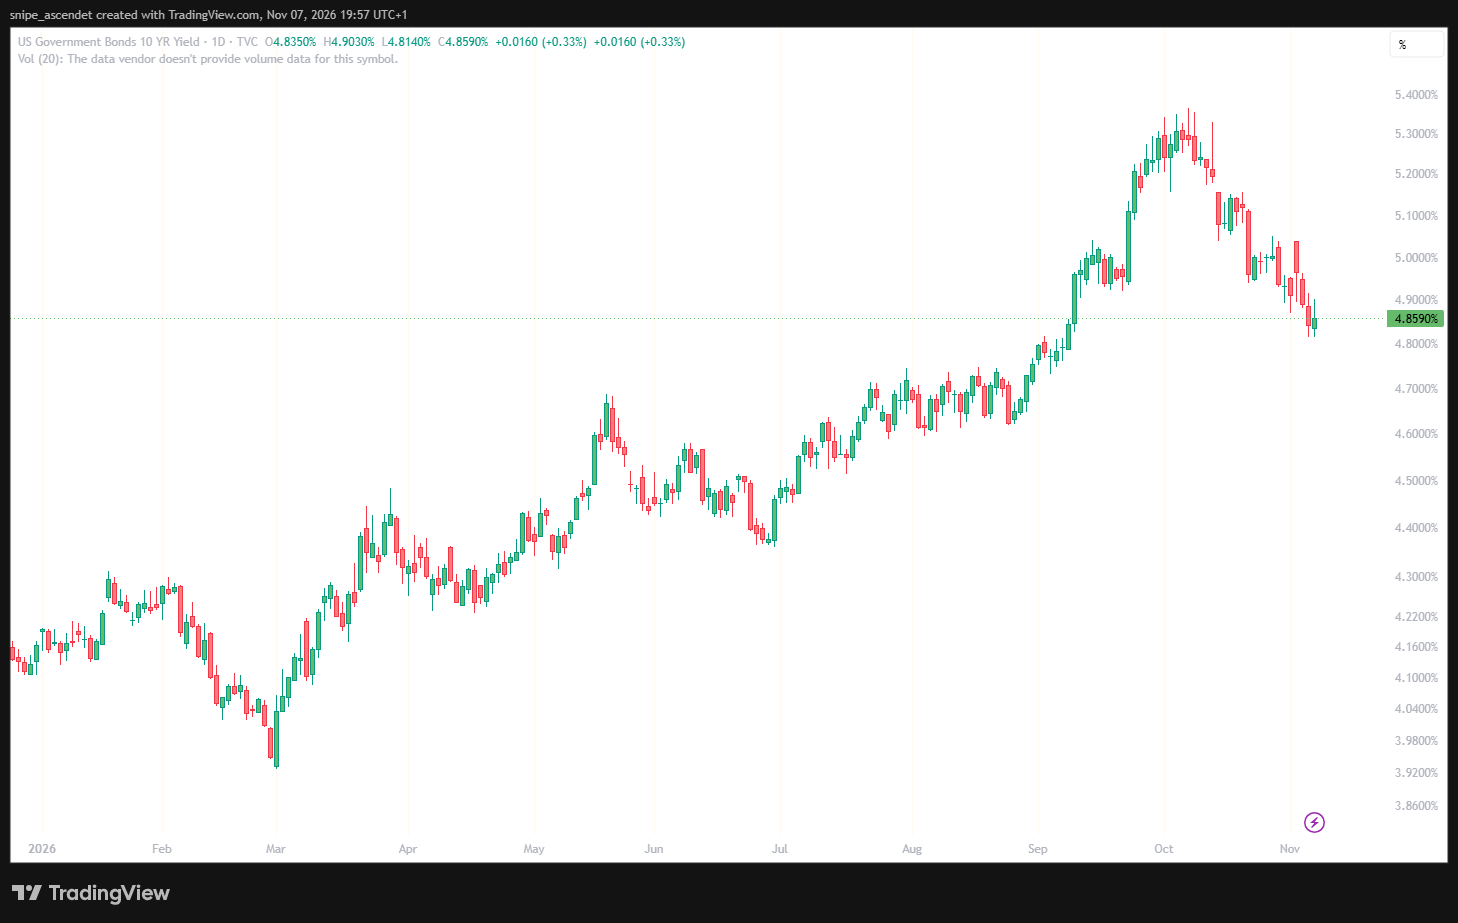
The US 10-year Treasury-yield screenshot shows 4.859% on November 6. Treasury yields are an indicator of the broader interest-rate environment, not a contractual borrowing rate for any of these borrowers. Individual financing costs also reflect credit spreads, collateral, tenor, floating-rate benchmarks and covenant terms. A lower 10-year yield would not necessarily rescue a project whose operating cash flow is insufficient.
Debt comparison: the four risk profiles at a glance
| Company | Latest balance-sheet reference | Key funding or liquidity test |
|---|---|---|
| CoreWeave (CRWV) | $35.6B indebtedness; $5.524B cash (June 30) | Heavy financing and 2026-27 scheduled principal payments |
| IREN (IREN) | $10.208B debt incl. finance leases; $3.522B unrestricted cash (Sept. 30) | $6B targeted funding within remaining FY27 expansion plan |
| Nebius (NBIS) | $8.546B debt; $8.042B cash (June 30) | Oct. 22 $3.5B facility has 364-day tenor |
| Applied Digital (APLD) | ~$6.4B debt; $2.950B unrestricted cash (Aug. 31) | Construction cash needs before lease revenue ramps |
Comparability limitation: dates differ, debt classifications differ and some companies hold restricted cash or have undrawn secured facilities. The figures above are reporting snapshots rather than real-time debt totals. None of the four can be ranked reliably using one debt-to-cash ratio alone.
Three scenarios for 2027 and the signals investors should track
Bull case: contracted capacity converts into cash
AI customers take delivery as scheduled, prepaid deposits translate into services, occupancy or GPU utilization rises, and debt matures more slowly than operating cash expands. Under this scenario, companies can refinance at reasonable spreads and reduce reliance on new share issuance. The most useful indicators would be operating cash after working-capital changes, actual capex versus guidance, and falling financing costs relative to revenue.
Base case: growth continues, but external capital remains necessary
Contracted demand stays strong, while new deployments require successive debt facilities, customer prepayments and occasional equity raises. Free cash flow remains volatile. In this scenario, the investment outcome depends as much on borrowing terms and dilution as on sales growth. Nebius’s bridge-facility maturity and IREN’s incremental funding plan become important monitoring points.
Bear case: delayed delivery meets tighter credit
A delay in energizing campuses, a fall in GPU rental economics, a customer renegotiation or a widening credit spread forces additional liquidity measures. Equity dilution, slower growth and higher financing costs could follow. A crisis would require evidence such as failed refinancing, material covenant problems, impaired access to liquidity or missed obligations; large capex alone does not establish one.
- CoreWeave: review its announced November 10 results for updated debt, maturities, liquidity and interest burden.
- IREN: track the $6 billion targeted funding program and January-to-February 2027 delivery milestones.
- Nebius: check November 12 results and any takeout, repayment or extension plan for its short-term Citi facility.
- Applied Digital: monitor new facility deliveries, rental commencement, secured-debt terms and its exposure to CoreWeave.
The decisive metric for all four is not the largest announced customer contract. It is the amount of unrestricted cash a business can retain after funding the infrastructure needed to honor that contract. The evidence points to heightened financing and execution risk, not a verified sectorwide debt crisis as of November 7, 2026.