

AMD’s Data Center revenue nearly doubled to $8.55 billion in the third quarter of 2026, but Nvidia’s latest reported quarterly Data Center sales were $89.02 billion. That leaves an approximately $80.48 billion quarterly revenue difference between the two companies’ latest published snapshots. The crucial issue for investors is not whether AMD can sell more AI hardware. It already is. The question is whether the company can narrow Nvidia’s lead while converting accelerating sales into durable profit and cash flow.
AMD reported its results on November 3 for the quarter ended September 26. Nvidia’s latest published results, released August 26, cover the quarter ended July 26. Those periods are not identical, and their Data Center definitions include products beyond standalone AI GPUs. The numbers are useful measures of commercial scale, not direct measurements of GPU unit share.
AMD vs. Nvidia: the revenue gap is still enormous
| Metric | AMD, Q3 2026 | Nvidia, Q2 FY2027 |
|---|---|---|
| Quarter ended | Sept. 26, 2026 | July 26, 2026 |
| Total revenue | $13.377 billion | $96.221 billion |
| Data Center revenue | $8.546 billion | $89.023 billion |
| Data Center revenue growth, year over year | 97% | 117% |
| GAAP gross margin | 54% | 75.0% |
| GAAP operating income | $2.832 billion | $63.734 billion |
| GAAP operating margin | 21% | 66.2% (calculated) |
| Free cash flow, company definition | $0.554 billion | $21.341 billion |
Sources: AMD third-quarter earnings release and Nvidia second-quarter fiscal 2027 earnings release. Dollar amounts and margins refer to the stated reporting periods; free cash flow is a non-GAAP measure and the definitions are not identical.
Nvidia generated approximately 10.4 times AMD’s Data Center revenue in these snapshots. The absolute gap is more instructive than the headline growth rates. Based on the companies’ corresponding year-earlier quarters, AMD’s Data Center sales increased from $4.341 billion to $8.546 billion; Nvidia’s increased from $41.096 billion to $89.023 billion. The difference between the two published quarterly amounts therefore grew from about $36.76 billion to $80.48 billion, although the companies report on different fiscal calendars.
AMD’s Data Center business combines EPYC server processors and Instinct accelerators. Nvidia’s Data Center revenue includes accelerated-computing infrastructure and networking. Neither company provides a directly comparable, complete revenue split for AI accelerator chips alone in these headline figures. Claiming an exact GPU market-share percentage from this table would be misleading.
AMD’s earnings show momentum, but the stock is volatile
AMD’s third-quarter consolidated revenue grew 45% from a year earlier to $13.377 billion. Data Center sales rose 97%, supported by EPYC demand and the launch of the MI450 series. The segment generated $2.882 billion in operating income, equivalent to about 33.7% of its reported segment revenue, although shared corporate costs sit elsewhere in AMD’s reporting. The growth is substantial even before assigning a precise portion to AI GPUs.
AMD forecasts approximately $17 billion in fourth-quarter revenue, plus or minus 3%, with a non-GAAP gross margin of about 55%. This is a companywide outlook, not a Data Center or AI GPU sales target. It implies continued expansion, but it cannot establish how quickly the Nvidia gap will close.
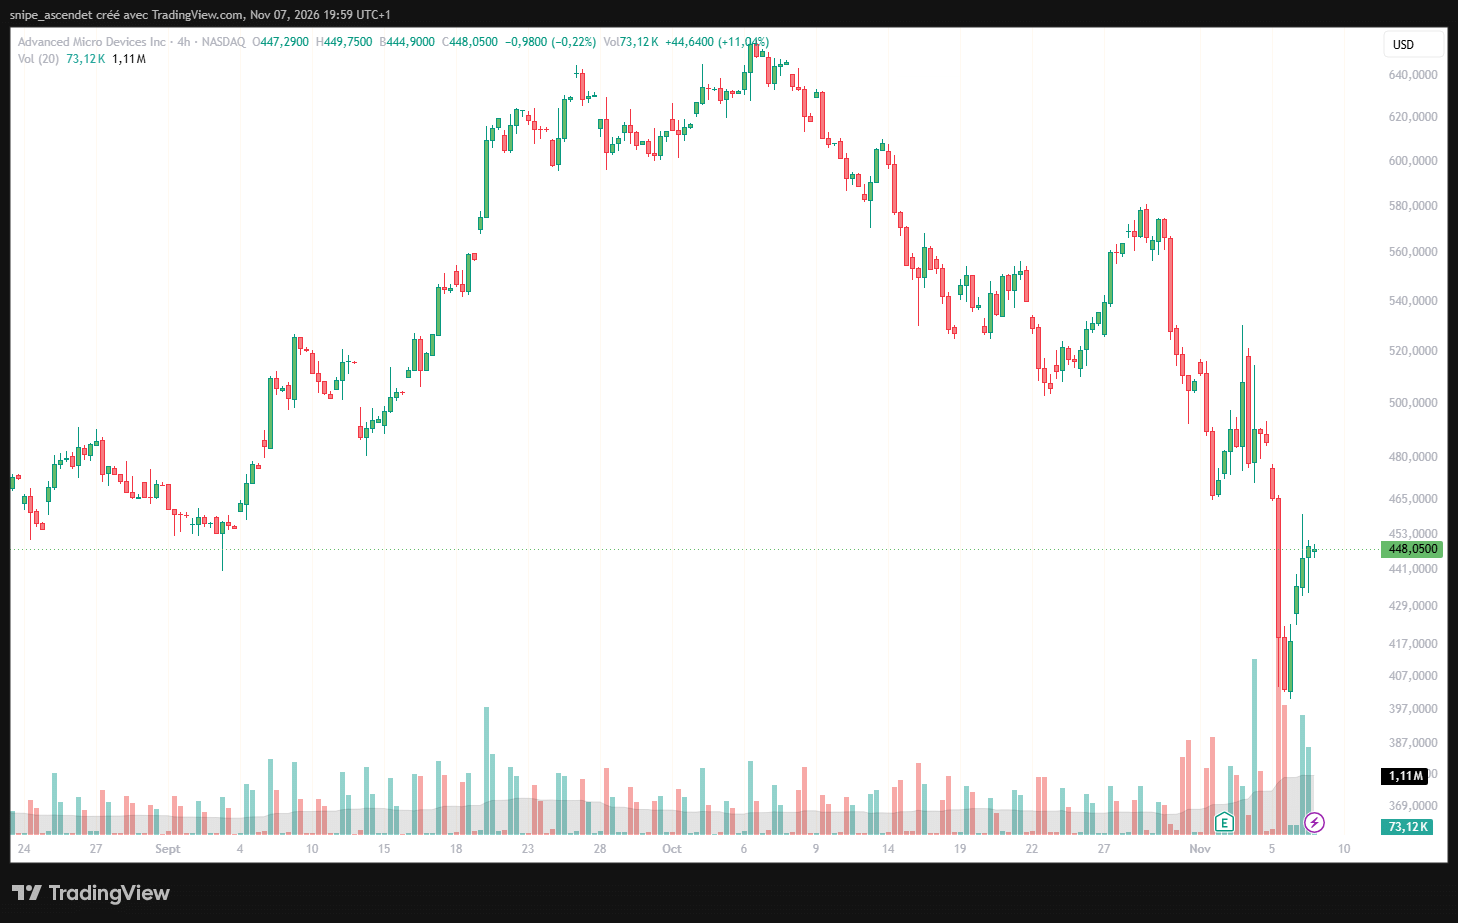
The market reaction illustrates how challenging expectations have become. AMD closed November 5 at $404.40, down 17.26% for that session, on approximately 71.24 million shares traded. It rebounded 11.04% on November 6 to a regular-session close of $449.04, with about 45.76 million shares traded. November 5 was also a broad technology-sector selloff, so attributing the entire move to AMD’s earnings would be incorrect. The rebound likewise does not establish that investors have settled on a long-term valuation.
MI450 and Helios versus Vera Rubin: the contest has moved beyond GPUs
AMD’s commercial opportunity rests on the Instinct MI450 family and its Helios rack-scale platform, which combines accelerators, EPYC CPUs, interconnects and system-level design. In its November results, AMD said Anthropic, Meta, Microsoft, OpenAI and Oracle Cloud Infrastructure were running models and workloads on initial Helios systems. That is evidence of deployment activity, not disclosure of recognized GPU revenue from each customer.
Nvidia is competing at a broader system level with Vera Rubin, alongside networking, CPUs and related software. In its August release, Nvidia said Rubin was ramping into full production and that racks were running with partners including Google Cloud, Microsoft Azure, Oracle Cloud Infrastructure, CoreWeave and Nebius. Its networking and platform integration can raise switching costs for customers already operating Nvidia-based clusters.
Chip specifications alone cannot determine the winner. AI operators evaluate training throughput, inference cost per token, memory capacity, system utilization, power requirements, software reliability and the time engineers spend making workloads function at scale. A lower hardware price is relevant only if it translates into a competitive total cost of ownership after networking, software and operating expenses.
ROCm is AMD’s route into Nvidia’s software moat
Nvidia’s CUDA environment benefits from years of developer adoption, optimized libraries, integration and operational familiarity. AMD’s response is ROCm. The company announced ROCm 10 in its latest earnings release, citing updates to frameworks, libraries, compilers and model support. Wider compatibility and dependable performance could make AMD a more practical second source for cloud providers seeking supplier diversity.
However, AMD does not need to displace CUDA across every workload to grow. It can target use cases with well-supported model architectures, customers willing to optimize software, and deployments where accelerator availability or procurement terms matter. The unresolved question is whether those wins extend from selected clusters into repeatable, high-volume orders without eroding AMD’s margins.
Profitability and free cash flow are the real dividing line
Nvidia’s scale translates into a major profitability advantage. It posted a 75% GAAP gross margin and $63.734 billion of GAAP operating income in its latest quarter, compared with AMD’s 54% margin and $2.832 billion of operating income. The difference reflects business mix, pricing power and scale, not a clean GPU-versus-GPU margin comparison.
The cash comparison is particularly important. AMD generated $1.202 billion of operating cash flow and spent $648 million on property and equipment, leaving $554 million of company-defined free cash flow, a margin of approximately 4%. That was down from $1.558 billion of free cash flow in the preceding quarter despite higher revenue. Inventory, receivables, supplier payments and capital spending can make quarterly cash flow uneven, but investors need to see a more consistent conversion of growth into cash.
Nvidia generated $24.077 billion of operating cash flow and $21.341 billion of free cash flow in its most recent quarter, using its own definition, which also deducts certain principal payments. The comparison indicates far greater absolute cash-generating capacity. It should not be interpreted as a perfectly standardized free-cash-flow margin comparison.
AMD ended September with $15.776 billion in cash, cash equivalents and short-term investments, against $7.079 billion of total debt. Nvidia reported $56.586 billion in cash, cash equivalents and marketable debt securities at the end of July, excluding substantial marketable equity holdings. These figures provide financial context, but Nvidia’s next results will provide a more recent balance-sheet snapshot. See the companies’ earnings statements and Nvidia’s SEC Form 10-Q.
The stock charts reveal different valuation risks
AMD’s daily chart shows how aggressively its stock rerated through 2026 before reversing in October and early November. Nvidia also lost substantial ground from its October highs, but its much larger realized earnings and cash flows put its valuation debate on a different footing. A lower share price does not mean a stock is cheaper in earnings terms; share counts, expected profits and cash generation determine that comparison.
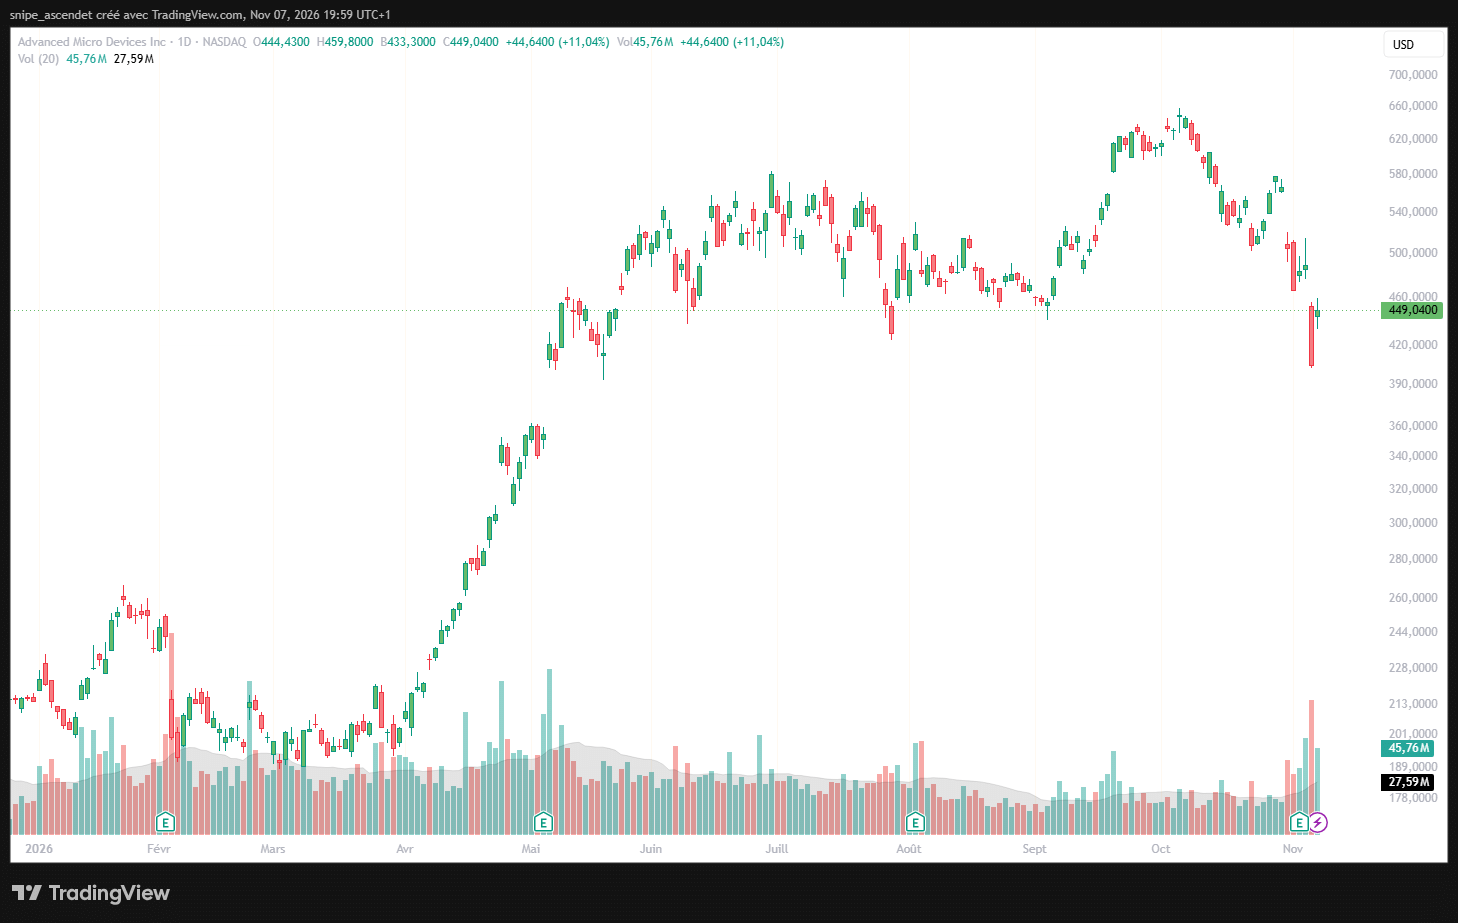
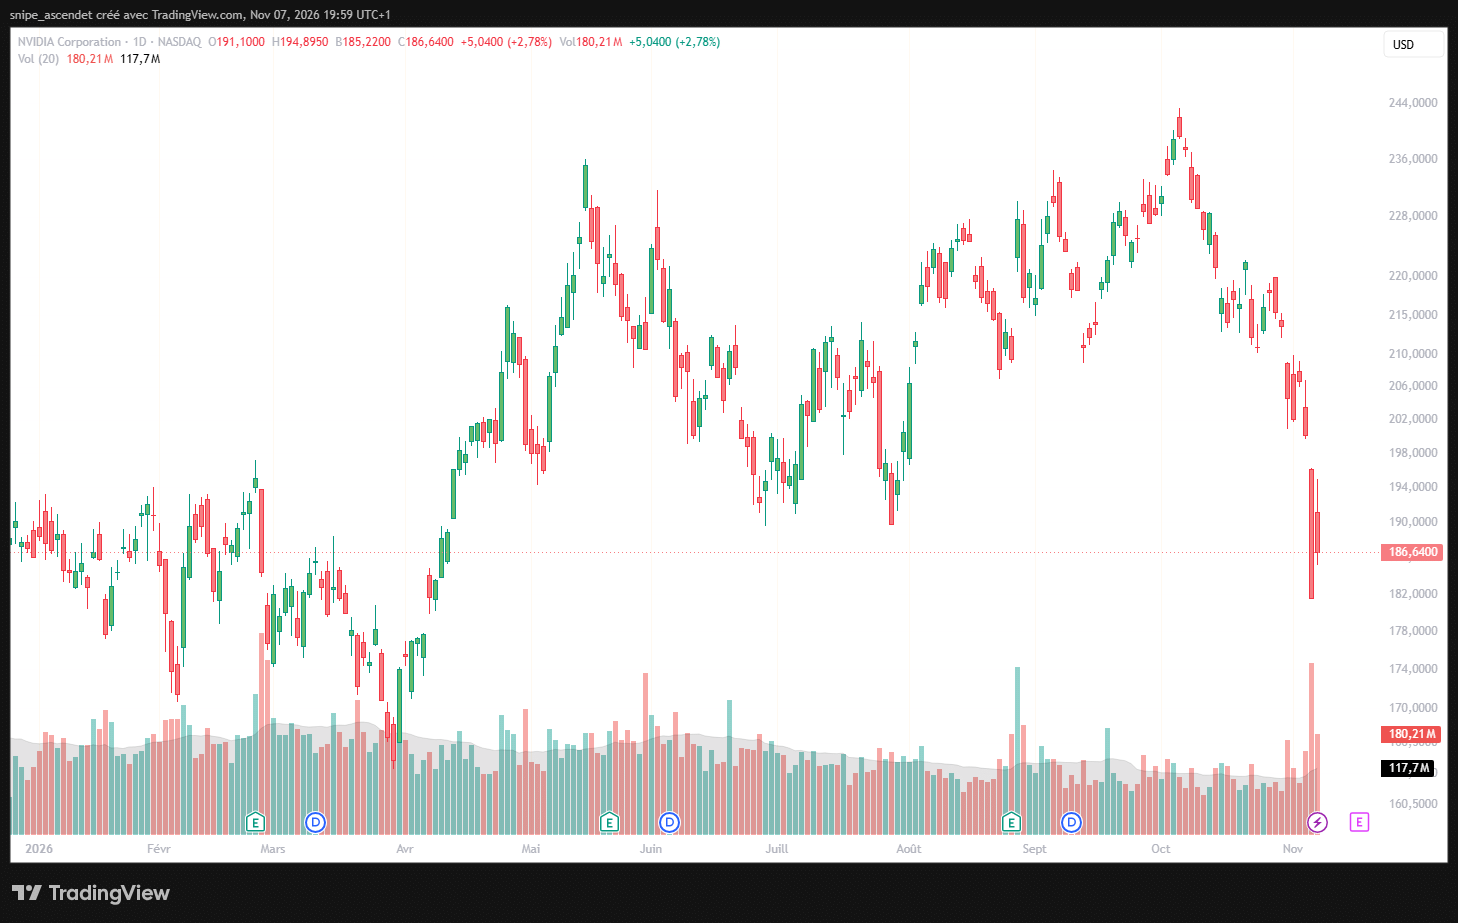
At the November 6 regular-session close, AMD stood at $449.04, up 11.04% on the day. Nvidia closed at $186.64, up 2.78%. These are official-session closing prices, not the later after-hours indications visible on some intraday charts. Over one day, AMD outperformed. That cannot establish relative valuation or a durable leadership change.
Nvidia’s November 17 earnings could reset the comparison
Nvidia plans to report fiscal third-quarter results on November 17, 2026. Its prior outlook called for approximately $108 billion of companywide revenue, plus or minus 2%, and a GAAP gross margin around 74%, plus or minus 0.5 percentage points. The company said that forecast did not assume Data Center compute revenue from China. These are management projections, not actual third-quarter results.
A fresh Data Center figure will help investors test whether Nvidia’s growth remains fast enough to widen the dollar gap despite AMD’s progress. Attention should also go to Rubin ramp execution, gross margin, receivables and cash conversion. Nvidia’s daily and four-hour charts show how sensitive market expectations have become ahead of this event.
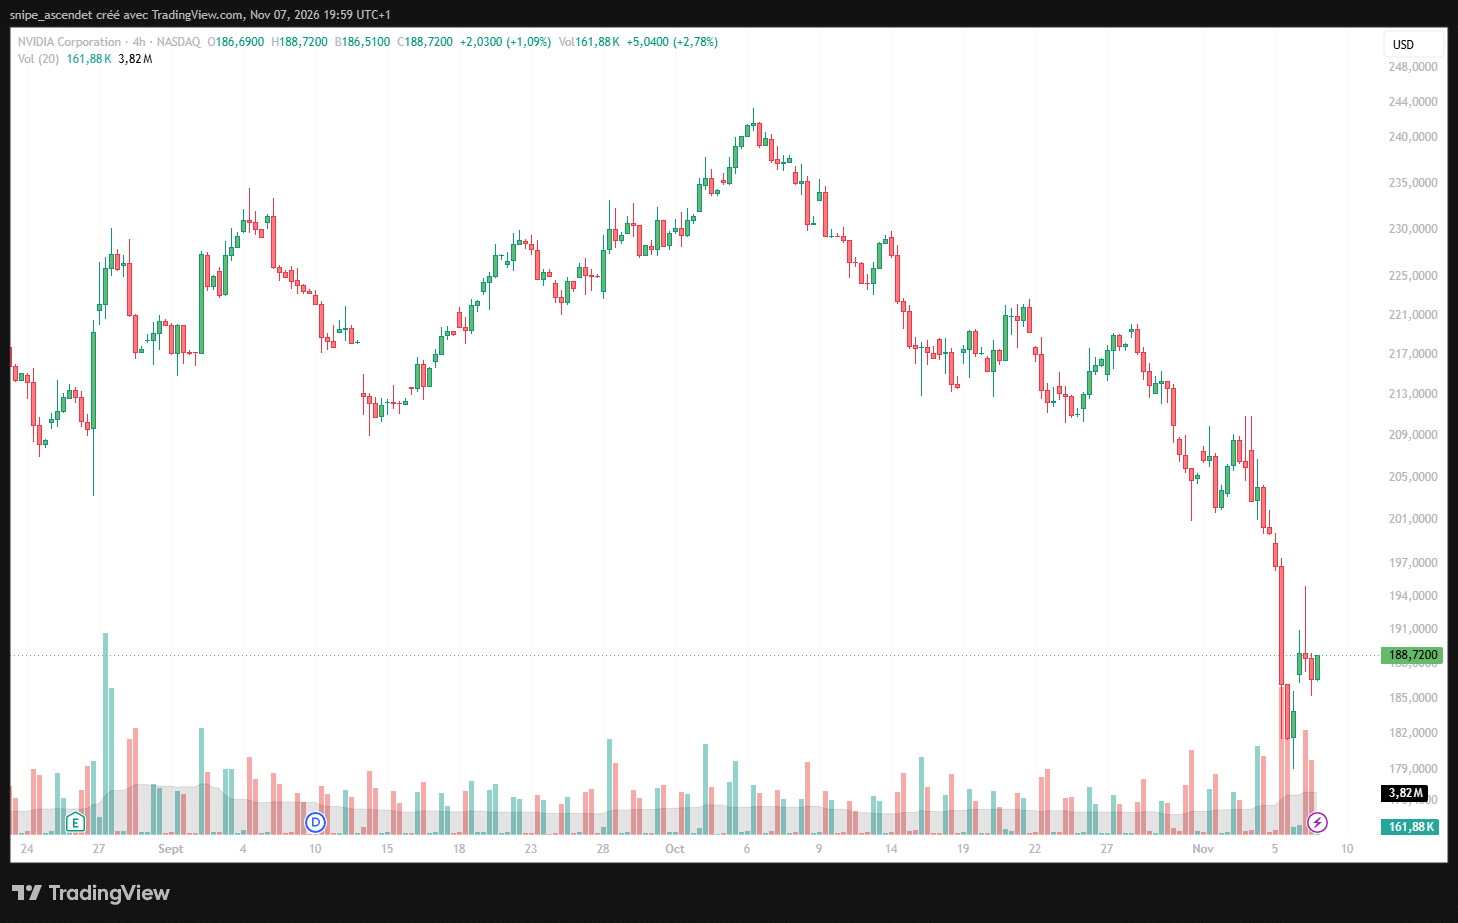
The reporting date comes from Nvidia’s October 28 investor relations announcement, not an inferred calendar estimate.
SOXX shows that this is also a sector-wide repricing
Both companies trade inside a volatile semiconductor complex. The iShares Semiconductor ETF, SOXX, closed November 5 down 12.15% and recovered 3.51% on November 6 to $136.53. That pattern is consistent with a broad sector selloff and partial rebound, rather than a simple two-company competitive verdict. The broader Nasdaq recovery analysis provides context for why a single rebound session is not enough to call a bottom.
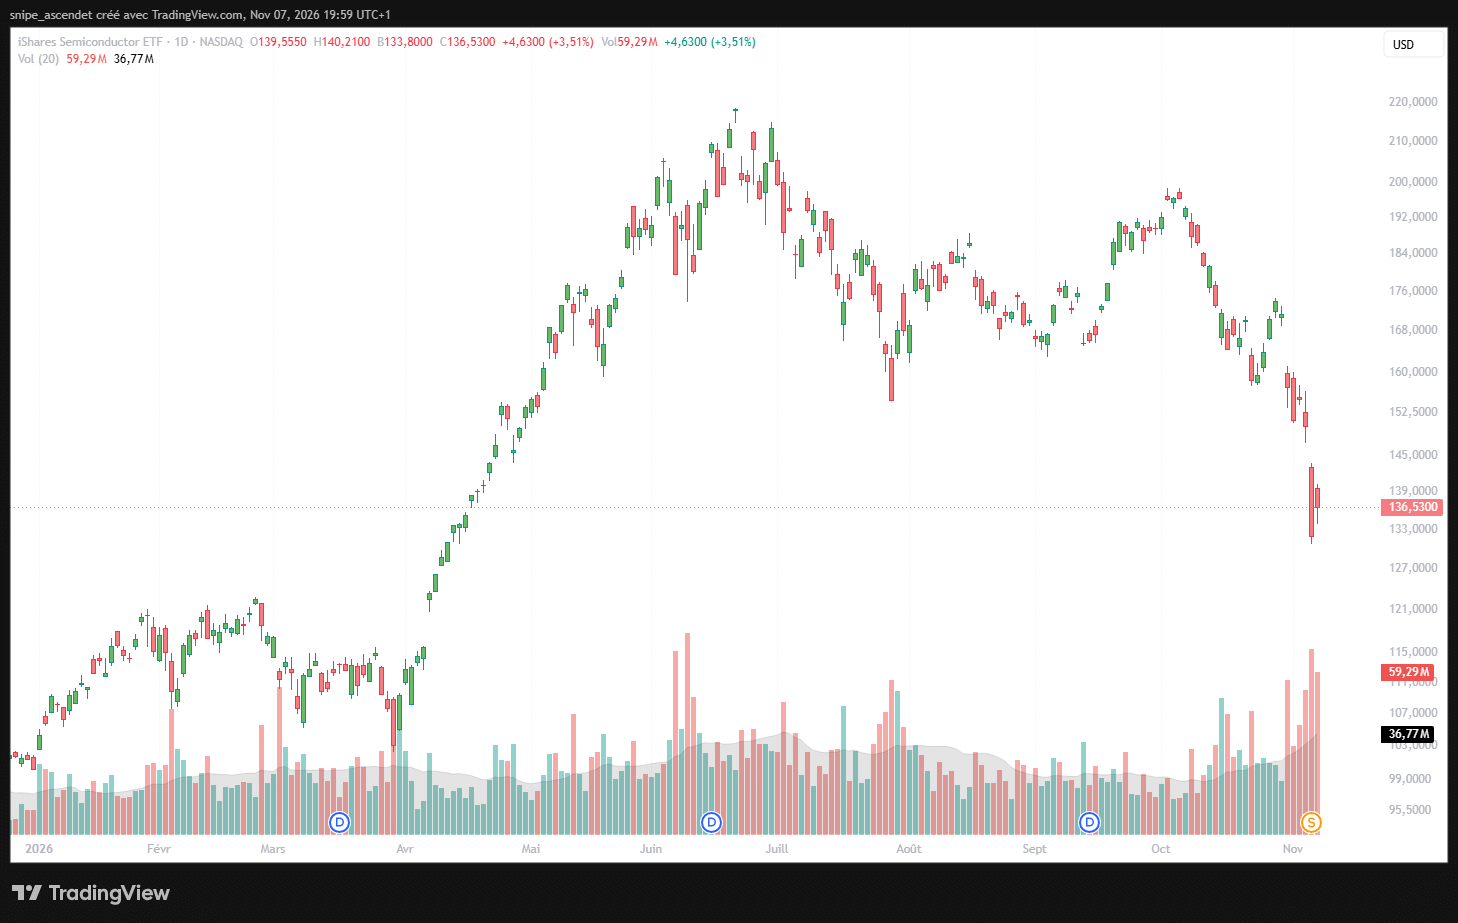
Technical adjustment: SOXX underwent a three-for-one forward stock split effective for trading on November 5, according to an SEC-filed iShares notice. Its longer-term chart must be read on a split-adjusted basis; the split itself is not an investment loss. In the wider semiconductor supply chain, Lam Research’s recent buyback provides another example of how equipment makers are reacting to the sector’s correction.
Three scenarios for AMD’s AI ambitions
- AMD gains traction: Helios deployments expand into repeat orders, ROCm lowers deployment friction, GPU sales grow faster than the broader Data Center segment, and operating cash flow improves. AMD could gain accelerator share even if Nvidia’s dollar lead remains large.
- Nvidia retains economic dominance: Rubin scales, CUDA and networking deepen customer lock-in, and Nvidia keeps generating larger incremental revenue and higher margins. AMD can deliver strong growth without closing the absolute gap.
- AI infrastructure spending cools: Hyperscalers slow deployments, financing becomes harder, or power and capacity bottlenecks delay projects. Both suppliers face estimate risk, with pricing, inventory and cash conversion becoming especially important.
What investors should track next
The most informative scorecard is not a single benchmark or claimed GPU market-share estimate. It is a combination of Data Center revenue growth, incremental quarterly dollars, segment profitability, gross margins, operating cash flow, and disclosed production-scale customer deployments. Product launch dates matter only when they turn into revenue and repeat business.
Bottom line: AMD has a credible path to becoming a larger AI infrastructure supplier, but there is no evidence yet that it is closing Nvidia’s absolute revenue or cash-flow lead. Its latest Data Center growth is impressive; Nvidia’s larger base is growing even faster. Until AMD demonstrates sustained accelerator scale and stronger cash conversion, investors should treat market-share potential as an opportunity, not a proven outcome.