


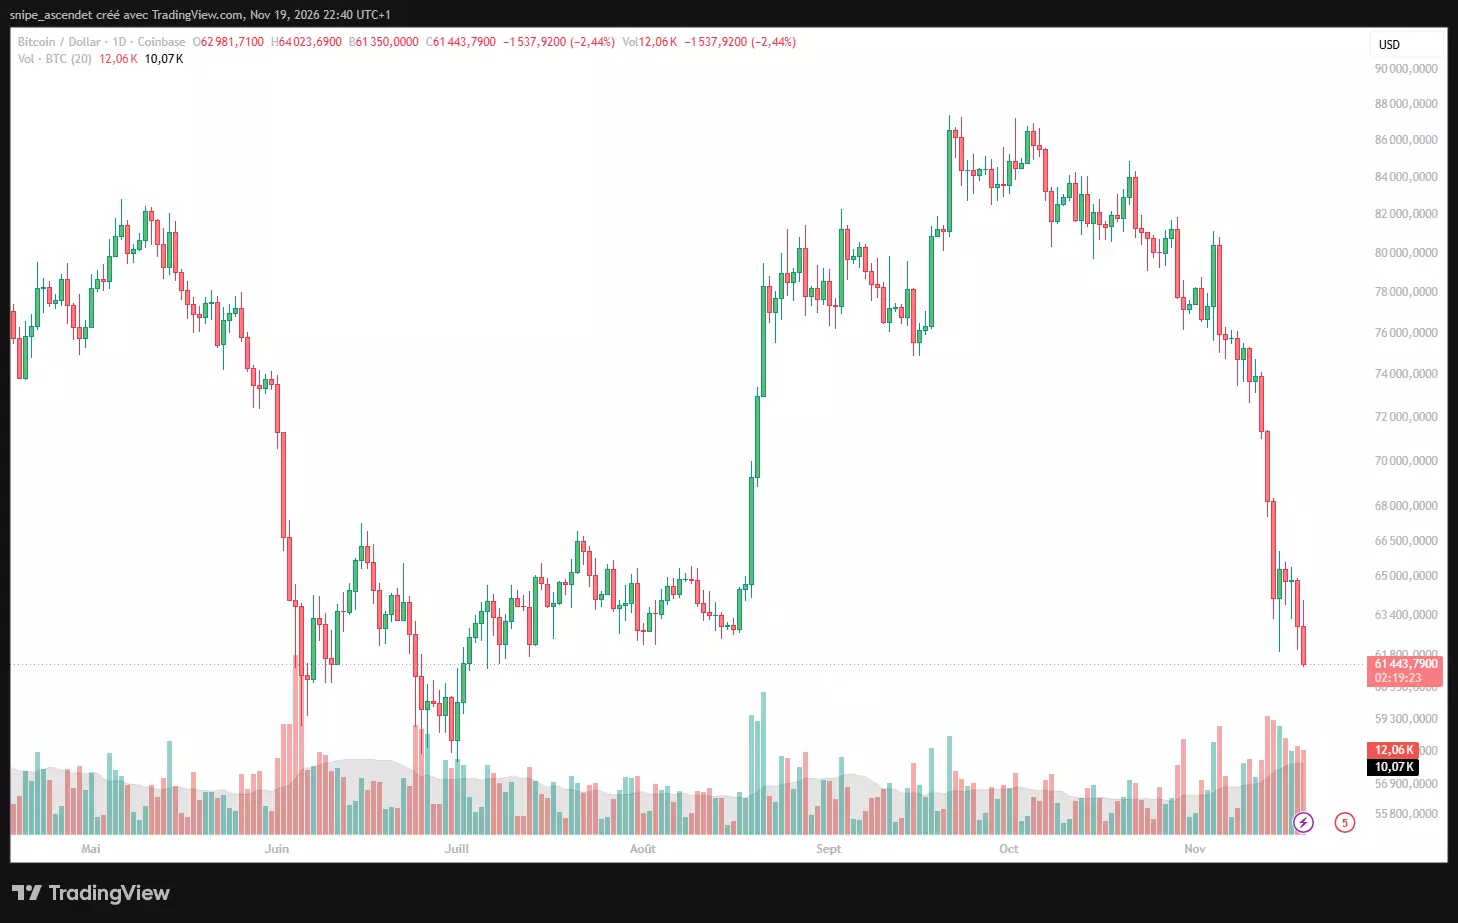
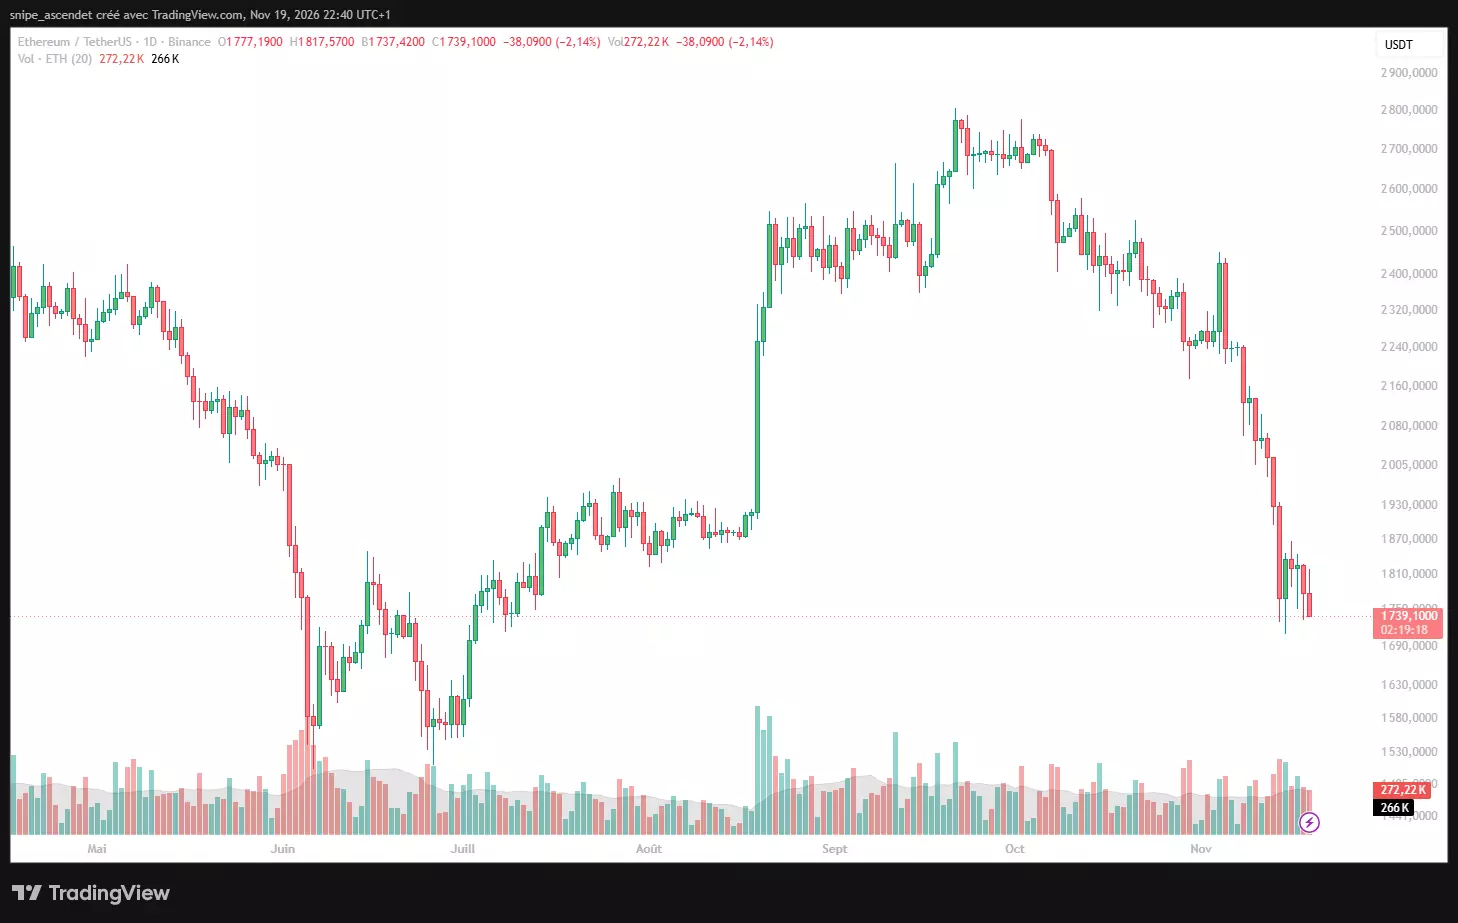
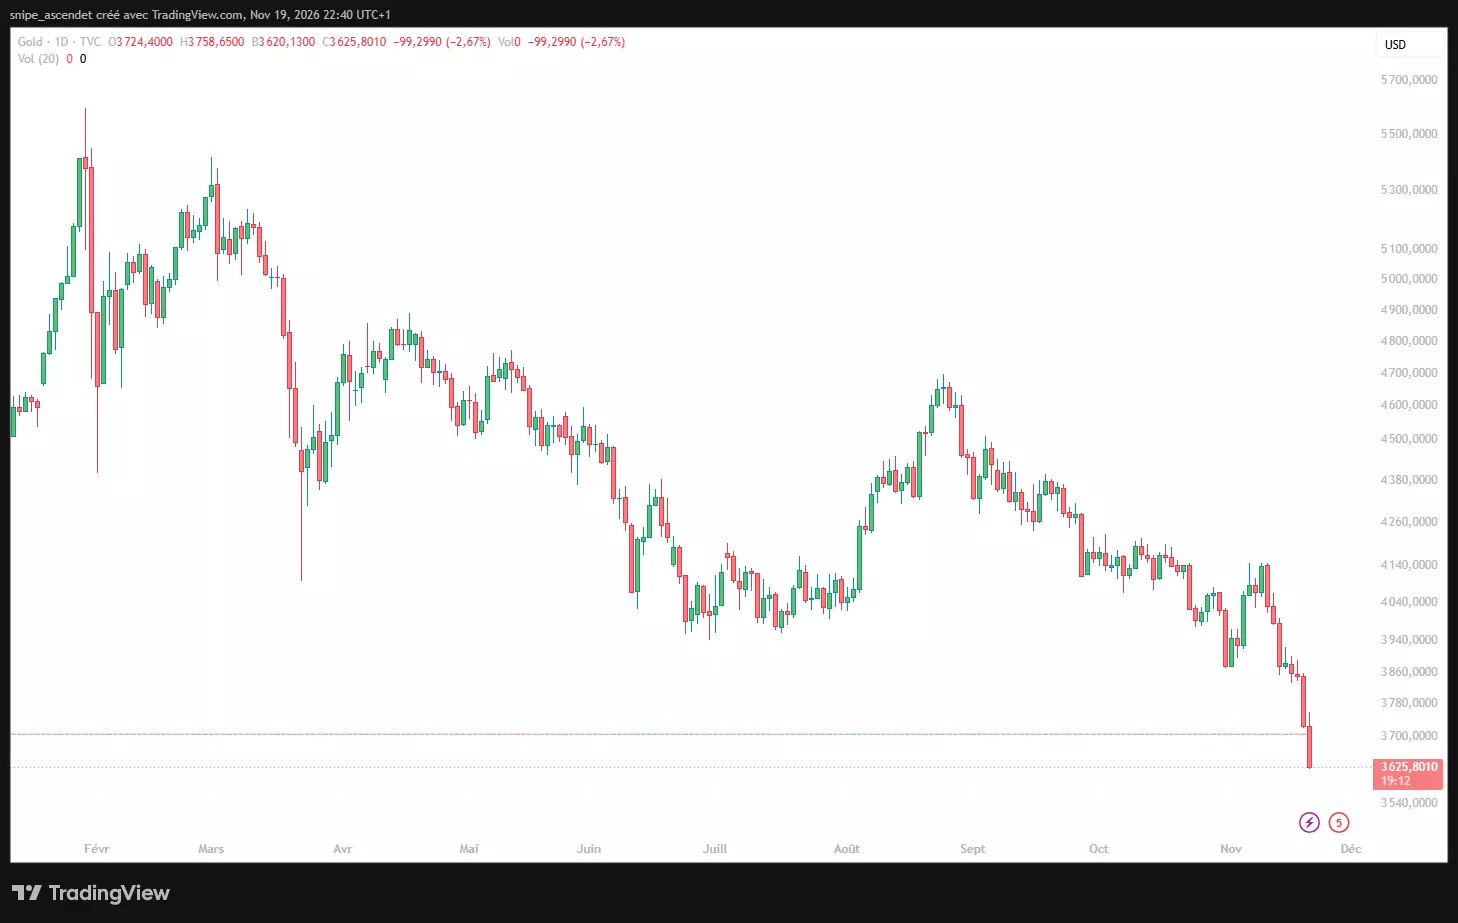
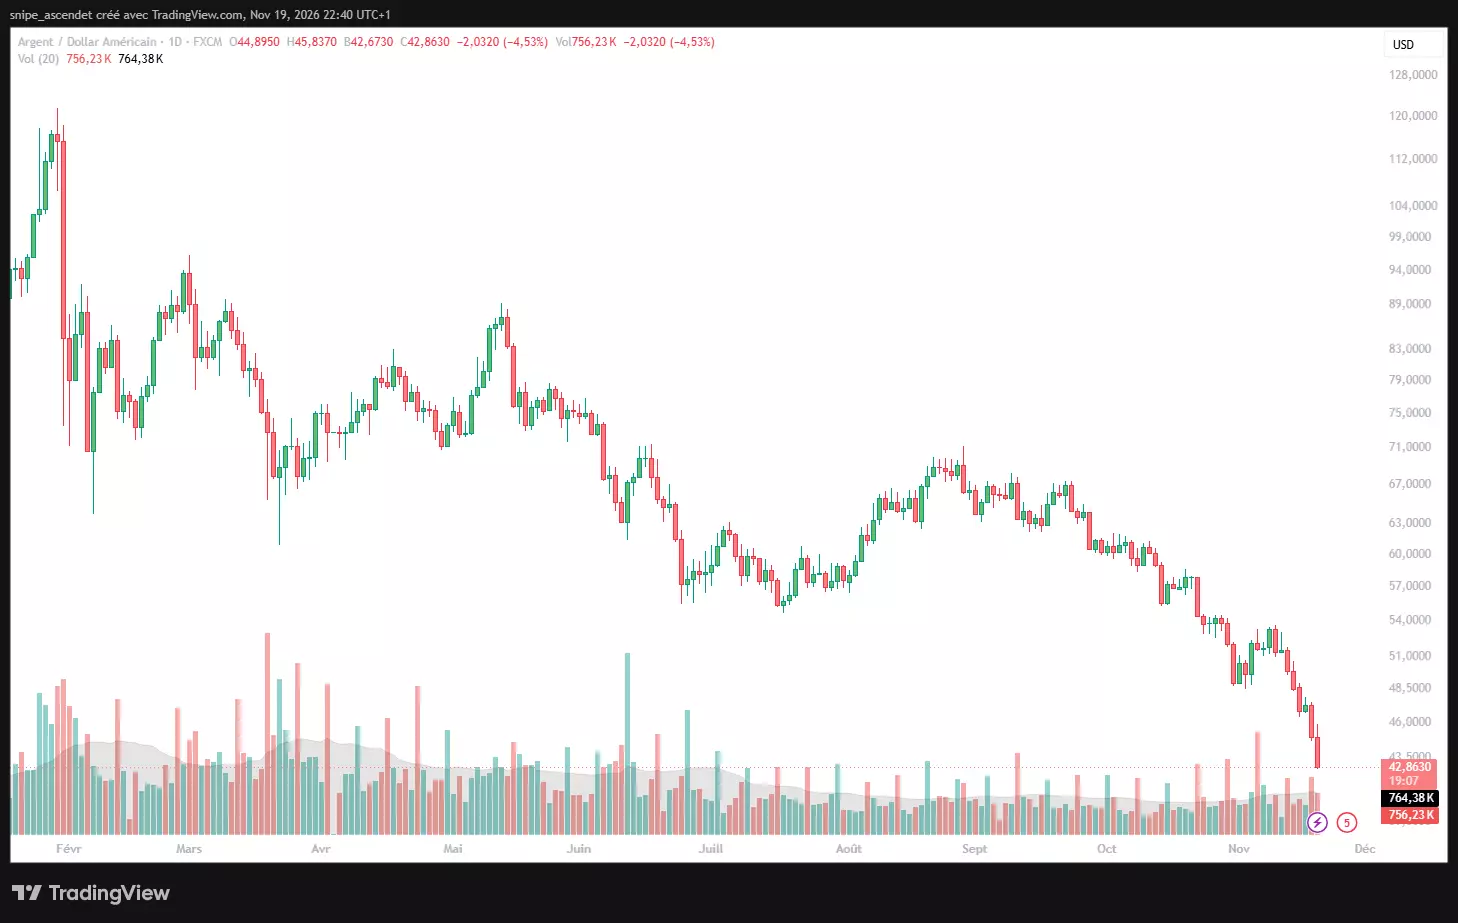
The Bitcoin selloff deepened as the cryptocurrency fell to $61,443.79 on Coinbase at approximately 4:40 p.m. ET on Thursday, November 19, 2026, down 2.44% for the trading day. Ether fell 2.14%, gold lost 2.67% and silver dropped 4.53%, while the S&P 500 finished 2.02% lower. The simultaneous retreat raises a question for shareholders: why are both speculative assets and traditional stores of value being sold?
The strongest common explanation is a tightening in financial conditions, driven by expectations of further Federal Reserve rate increases, a stronger dollar and reduced tolerance for leveraged positions. Anthropic’s historic stock-market debut added another test of appetite for risk, but its IPO did not by itself cause the losses across crypto and precious metals.
How Far Did the Bitcoin Selloff Spread Across Ethereum, Gold and Silver?
The five markets were lower at the same late-US-session reference point. Cryptocurrency and metal prices represent their quoted daily moves at approximately 4:40 p.m. ET; the S&P 500 figure is its official US cash-session close.
| Asset | November 19 price | Daily change |
|---|---|---|
| Bitcoin (BTC/USD, Coinbase) | $61,443.79 | -2.44% |
| Ethereum (ETH/USDT, Binance) | 1,739.10 USDT | -2.14% |
| Gold (TVC, USD/oz) | $3,625.80 | -2.67% |
| Silver (FXCM, USD/oz) | $42.863 | -4.53% |
| S&P 500 | 7,175.83 | -2.02% |
The equity decline extended beyond one sector: the Nasdaq Composite closed at 23,879.20, down 2.25%, and the Dow ended at 49,097.06, down 2.19%, according to Reuters’ closing market report. That breadth matters because isolated weakness in Bitcoin would imply a different risk picture from a decline spanning stocks, metals and digital assets.
Why Are Crypto and Precious Metals Falling at the Same Time?
The first pressure point is the Fed. Minutes of the October 27–28 FOMC meeting, released November 18, show that almost all participants expected additional rate increases would likely be appropriate. The committee kept its target range at 3.75% to 4.00% in October, but some participants wanted a quarter-point increase immediately and others contemplated a larger move if inflation remained unfavorable.
By the November 19 US market close, futures implied a 96.4% probability of a 25-basis-point hike at the December meeting, Reuters reported, citing CME FedWatch. Higher expected policy rates make interest-bearing dollar assets more competitive with assets that generate no contractual income, including Bitcoin, physical gold and silver.
The second pressure point is the dollar. Reuters reported on November 19 that the dollar index reached its highest level since April 2025 during the week. A stronger dollar raises the cost of dollar-denominated commodities for buyers using other currencies, while tighter global dollar liquidity can force funds to reduce risky exposures.
Third, falling markets can reinforce one another through collateral requirements. Investors using margin or leveraged derivatives may need cash when positions lose value, prompting sales of whatever assets remain liquid, not merely the assets that started the decline. That is a plausible amplification mechanism, not evidence of a specific dollar amount of forced liquidation on November 19.
Why Did Gold and Silver Fail to Act as Safe Havens?
Gold is often treated as a hedge against geopolitical and monetary instability, but it does not pay interest. When markets price a more restrictive Fed and favor the dollar, the opportunity cost of holding bullion rises. Reuters described gold hitting a 14-month low on November 19, with traders focused on inflation and higher US rates.
The gold series stood at $3,625.80 per ounce around 4:40 p.m. ET, with a daily low of $3,620.13. Silver was at $42.863 per ounce, having touched $42.673. Silver combines precious-metal demand with extensive industrial applications, so investors must also assess whether expensive financing and slower industrial growth could weaken its demand.
Silver’s 4.53% decline was roughly 1.7 times gold’s 2.67% daily decline in percentage terms. That sharper move is consistent with silver’s greater cyclical sensitivity and volatility, although one session cannot isolate how much of the decline arose from industrial-demand fears versus trading flows.
Did Anthropic’s $81 Billion IPO Pull Money Away From Other Assets?
Anthropic (NASDAQ: ANT) priced its public offering at $83 a share, raising $81.34 billion through 980 million shares, plus a separate $26 billion private placement. Its shares opened November 19 at $111.50 and finished at $97.17, still 17.07% above the IPO price but 12.85% below the opening trade, according to Reuters. The initial enthusiasm did not spread across the rest of the market.
A deal of that scale creates a genuine portfolio-allocation question. Investors seeking ANT exposure may sell other stocks, trim risk budgets or postpone purchases, as discussed in DualFinances’ coverage of Anthropic’s opening session. But there is no verified flow data showing that money left Bitcoin, gold or silver specifically to fund the IPO; treating the $107.34 billion combined financing figure as a same-day withdrawal from those markets would be misleading.
The larger connection is the AI investment cycle. Market concerns over the financing and profitability of enormous computing commitments have already spread through chipmakers and cloud infrastructure stocks. DualFinances’ analysis of the Fed’s AI financing risks explains how borrowing, leases and contractual commitments could magnify a market correction when capital becomes more expensive.
What Does the S&P 500 Break Below Its 200-Day Average Mean?
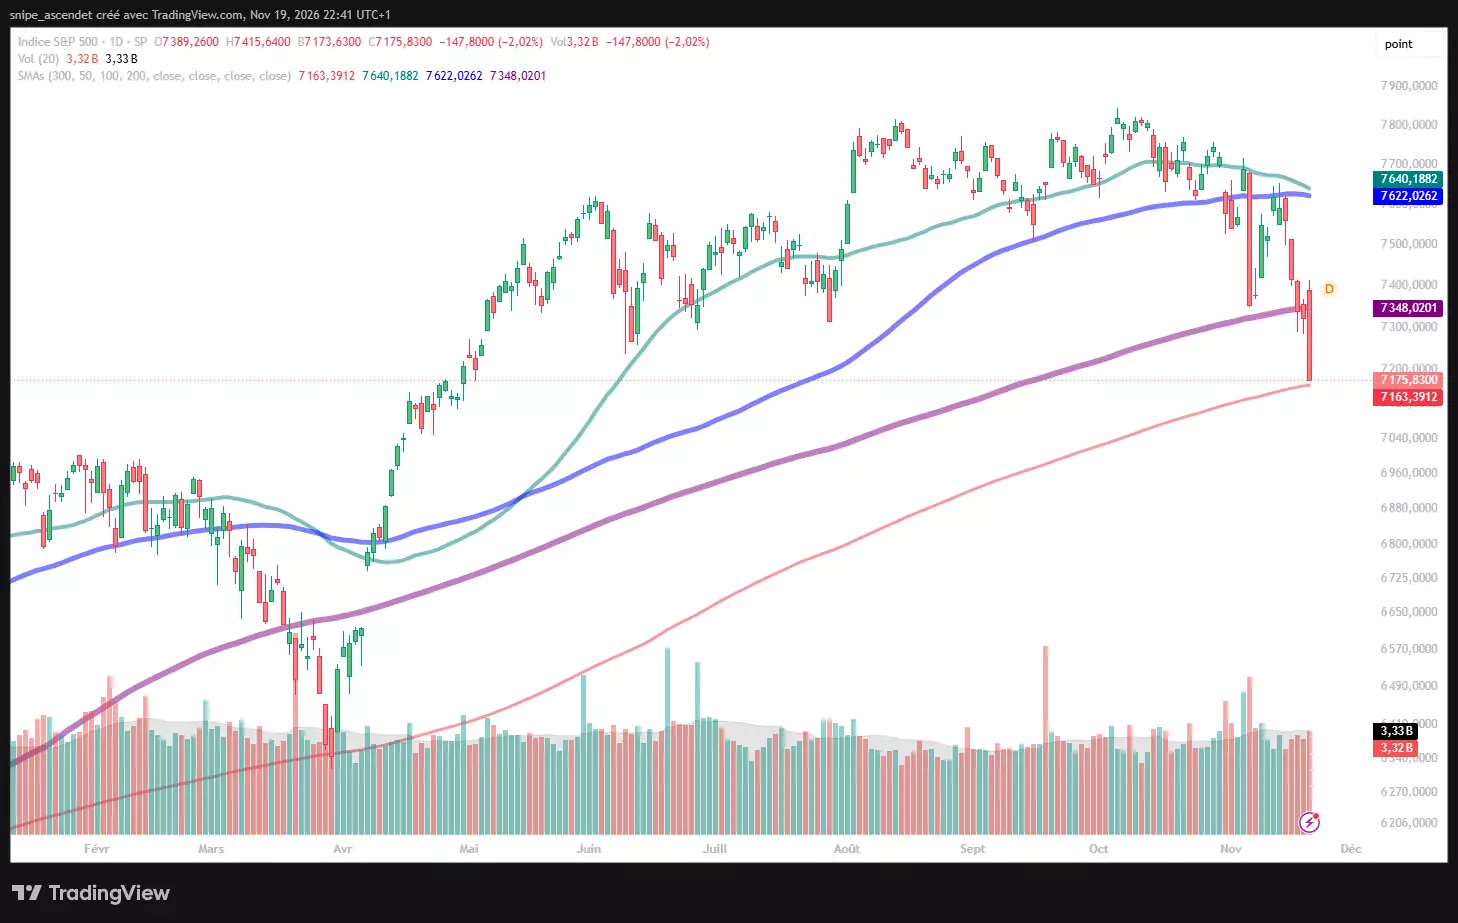
The S&P 500 closed at 7,175.83 on November 19, which was 172.19 points, or 2.34%, below its 200-day simple moving average of 7,348.02. This widely followed trend gauge now sits above the market and could act as a reference point for any sustained recovery.
There is an important second threshold. The index finished only 12.44 points, or 0.17%, above its 300-day average of 7,163.39. A move below that line would deepen the technical damage, while recovery through 7,348.02 would be a more meaningful first step toward repairing the longer-term trend.
The S&P 500 has recorded six consecutive down sessions, and more than 90% of its constituents fell November 19, according to the Associated Press. That weakness makes the cross-asset selloff more concerning than a cryptocurrency-specific correction, even though moving-average breaks are indicators rather than forecasts.
Do Bitcoin and Ether ETF Outflows Confirm Weak Demand?
US spot cryptocurrency funds showed measurable withdrawals before the November 19 session. Farside Investors’ Bitcoin ETF data recorded $239.9 million of net Bitcoin ETF outflows on November 17 and another $306.5 million on November 18. Its Ether ETF series recorded $29.1 million and $39.8 million of net outflows on those respective dates.
| US spot ETF net flows | Bitcoin ETFs | Ether ETFs |
|---|---|---|
| November 17, 2026 | -$239.9 million | -$29.1 million |
| November 18, 2026 | -$306.5 million | -$39.8 million |
| Two-day total | -$546.4 million | -$68.9 million |
These flows indicate that part of institutional crypto demand was retreating before the latest drop. The November 19 final ETF figures had not yet been reported at the reference time. For a longer look at the sequence of losses, see why Bitcoin was already sliding earlier in November. Ether’s 2.14% daily fall was smaller than Bitcoin’s 2.44%, so the figures do not support a claim that Ether underperformed on this particular session.
Which Prices and Events Matter After the Selloff?
The immediate levels are reference points rather than guaranteed support or resistance. Intraday lows mark areas where buyers appeared during November 19 trading; round-number levels can matter because trading orders often cluster around them.
| Market | Near-term downside reference | Recovery reference |
|---|---|---|
| Bitcoin | $61,350 session low, then $60,000 | $65,000 |
| Ether | 1,737.42 USDT session low, then 1,700 | 1,800 USDT |
| Gold | $3,620.13 session low | $3,700 per ounce |
| Silver | $42.673 session low | $45 per ounce |
| S&P 500 | 7,163.39 (300-day average) | 7,348.02 (200-day average) |
The major scheduled policy catalyst is the December 8–9, 2026 FOMC meeting, as listed on the Federal Reserve’s meeting calendar. Before then, inflation releases, Treasury-yield moves and finalized ETF flow data will help investors assess whether liquidity is stabilizing. Bitcoin and Ether also trade around the clock, meaning fresh moves can occur while US stock exchanges are closed.
Bottom line: The November 19 fall in Bitcoin, Ether, gold, silver and US equities is best understood as a common repricing of interest-rate expectations and risk, reinforced by a strong dollar and deteriorating equity breadth. Anthropic’s IPO underscored the market’s uncertainty about the AI trade, but the data do not establish a direct transfer of cash from crypto or metals into ANT. The next tests are whether the S&P 500 can hold its 300-day average, ETF redemptions slow and incoming inflation figures alter expectations for the December Fed meeting.
For informational purposes only; not investment advice.