


U.S. stocks suffered another broad selloff on Thursday, November 19, as the S&P 500 dropped 2.03% to a preliminary 7,175.24 and moved deeper below its 200-day moving average. A record-breaking IPO from Anthropic (NASDAQ: ANT) sparked an early technology rally but could not stop a reversal that left investors confronting a more difficult combination of weak AI stocks, higher-for-longer interest rates and geopolitical risk.
The benchmark has now fallen about 8.2% from its October record close, according to the Associated Press. For shareholders, the central issue is no longer whether an individual AI company can attract capital, but whether the wider market can defend its long-term trend and support earnings expectations at today’s financing costs.
Wall Street closes sharply lower: The numbers
Preliminary closing figures reported by Reuters show losses across all three major benchmarks:
| Index | November 19 close | Daily change |
|---|---|---|
| S&P 500 | 7,175.24 | -2.03% |
| Nasdaq Composite | 23,885.88 | -2.23% |
| Dow Jones Industrial Average | 49,095.46 | -2.20% |
The Dow lost more than 1,100 points. More than 90% of S&P 500 components declined, according to AP. The index recorded a sixth consecutive lower close, its longest losing run since 2024, according to AP and Dow Jones Market Data as cited by MarketWatch.
The breadth of the decline is important. Weakness was not confined to a handful of highly valued chip stocks. When most members of the benchmark fall together, diversification within a large-cap equity portfolio offers less protection against a market-wide repricing.
The S&P 500 breaks its 200-day moving average, then approaches its 300-day line
The S&P 500 first closed below its 200-day moving average on November 17, ending a stretch above that threshold dating back to April 7, 2026. The initial breach therefore preceded Anthropic’s debut by two trading days. MarketWatch documented the break before Thursday’s deeper decline.
At Thursday’s close, the 200-day line was near 7,348 points. The index at 7,175.24 stood approximately 2.35% below it, a meaningful distance for a benchmark whose long-term uptrend had been supported by large technology stocks. Its 50-day and 100-day averages, around 7,640 and 7,622, were also overhead.
A second level matters immediately: the 300-day moving average was around 7,163, just 12 points, or 0.17%, below the preliminary S&P 500 close. If that area gives way, the psychological 7,100 and 7,000 levels may become the next reference points; they are potential watch zones, not guaranteed support.
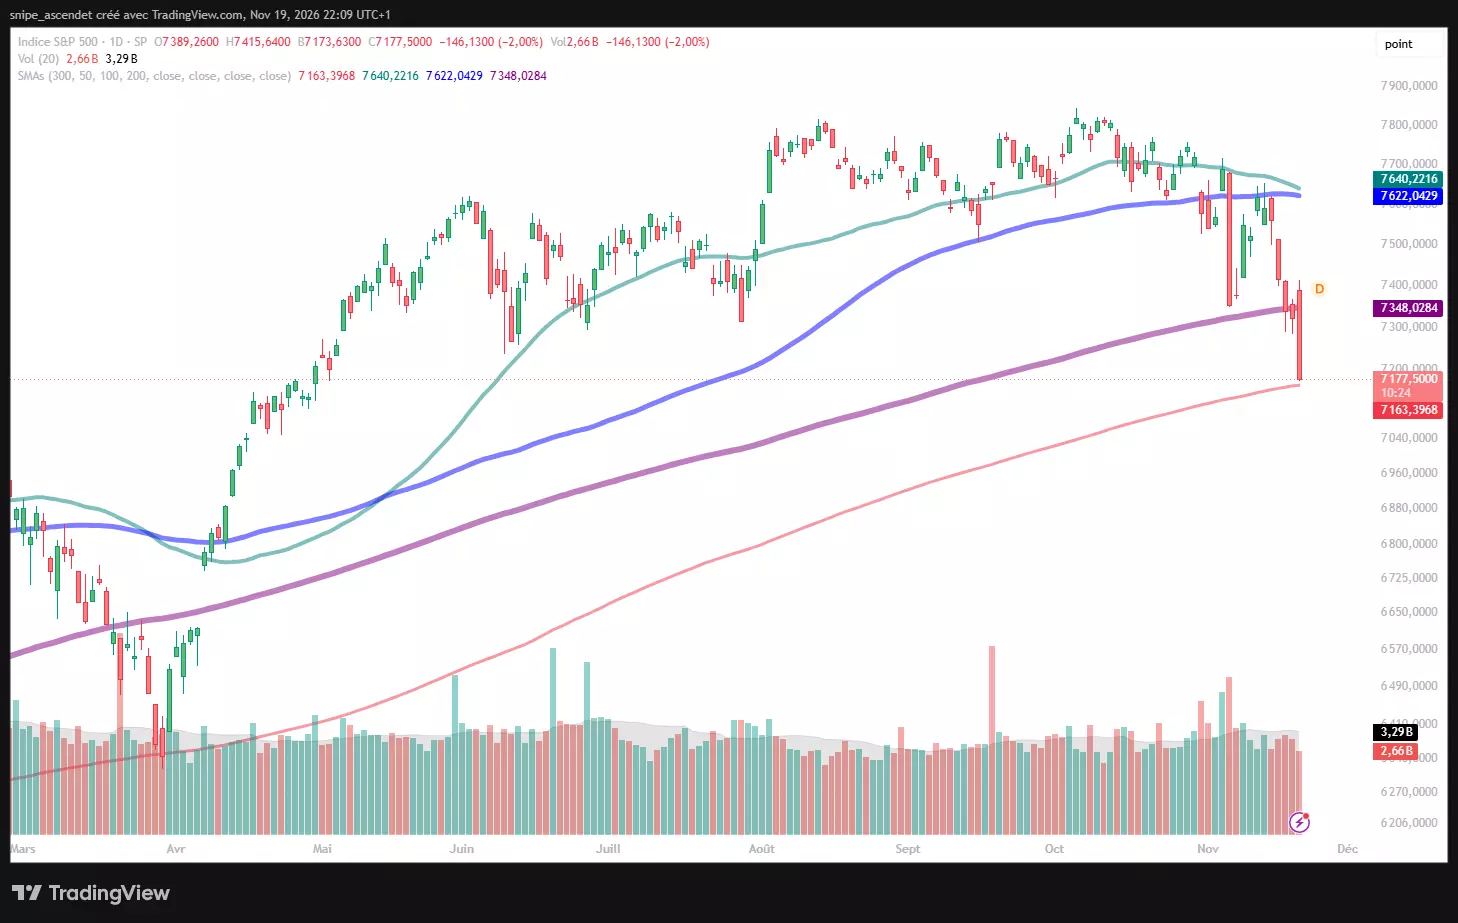
There is a historical echo. The previous spell below the 200-day measure came during the March-April 2026 market turbulence surrounding the Iran conflict. The present market is facing renewed Middle East uncertainty, but also an additional challenge: the repricing of AI investment economics and the cost of capital. A moving-average break describes weakening price momentum; by itself, it does not establish how far a correction will extend.
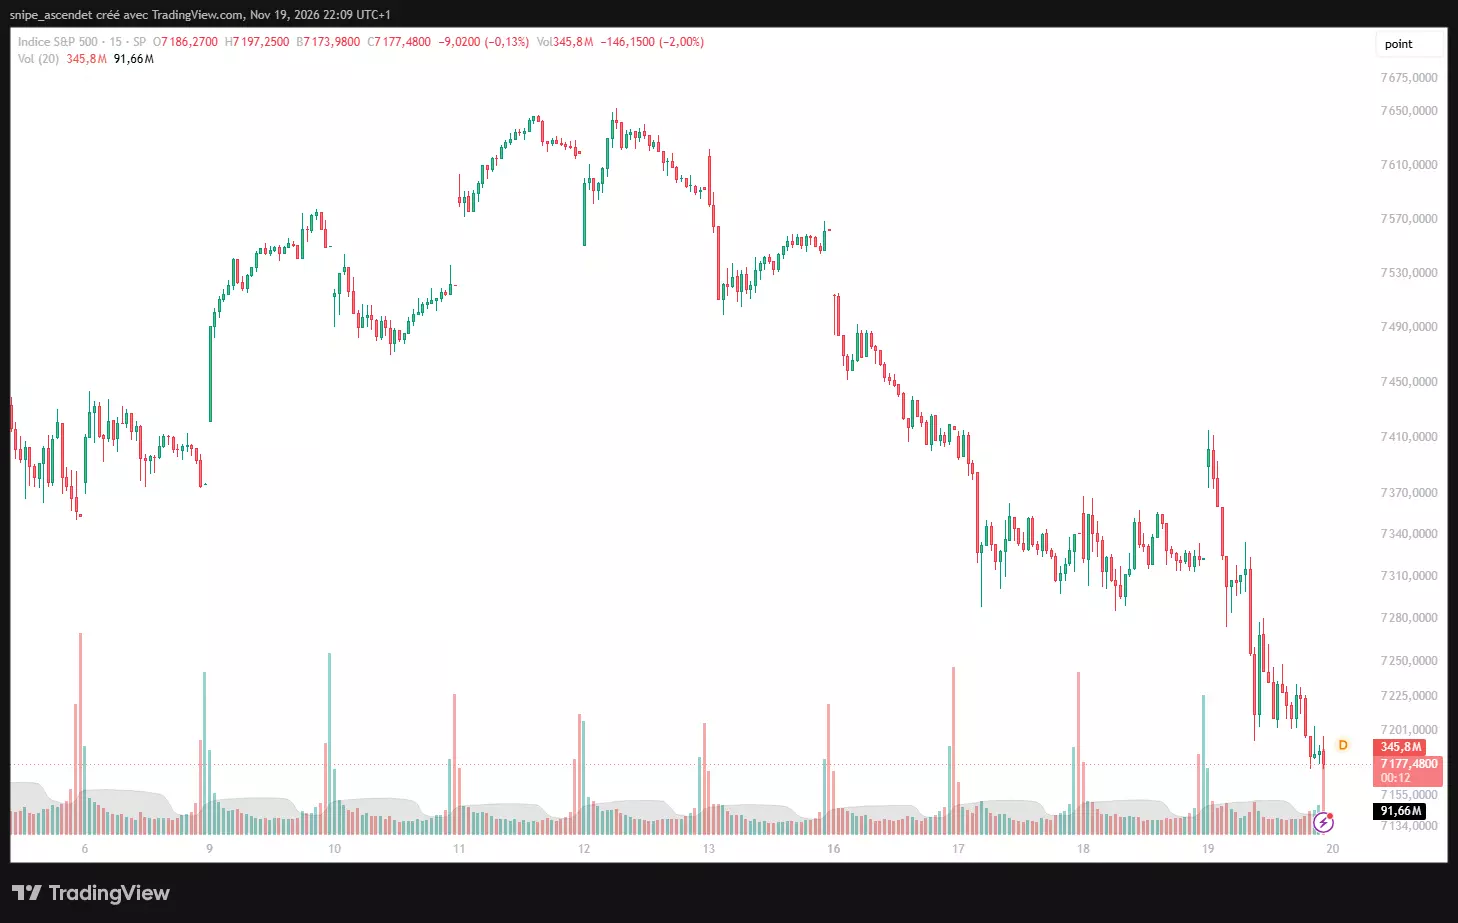
Thursday’s intraday reversal was more severe than the closing percentage suggests
Before Anthropic began trading, the S&P 500 climbed as much as 1.3% as investors anticipated a positive reception for the biggest IPO on record, according to AP. The index reached an intraday high around 7,415.64 but finished at the opposite end of the session’s range. From that high to the preliminary close, the decline was approximately 3.24%.
The 15-minute price action shows the morning optimism failing and selling accelerating through the afternoon. A market that cannot sustain a strong opening rally often signals investors are using rebounds to reduce exposure rather than adding aggressively to existing positions. That is particularly relevant when the rally begins with a major catalyst rather than a broad improvement in earnings or monetary conditions.
Anthropic’s historic IPO did not rescue the AI trade
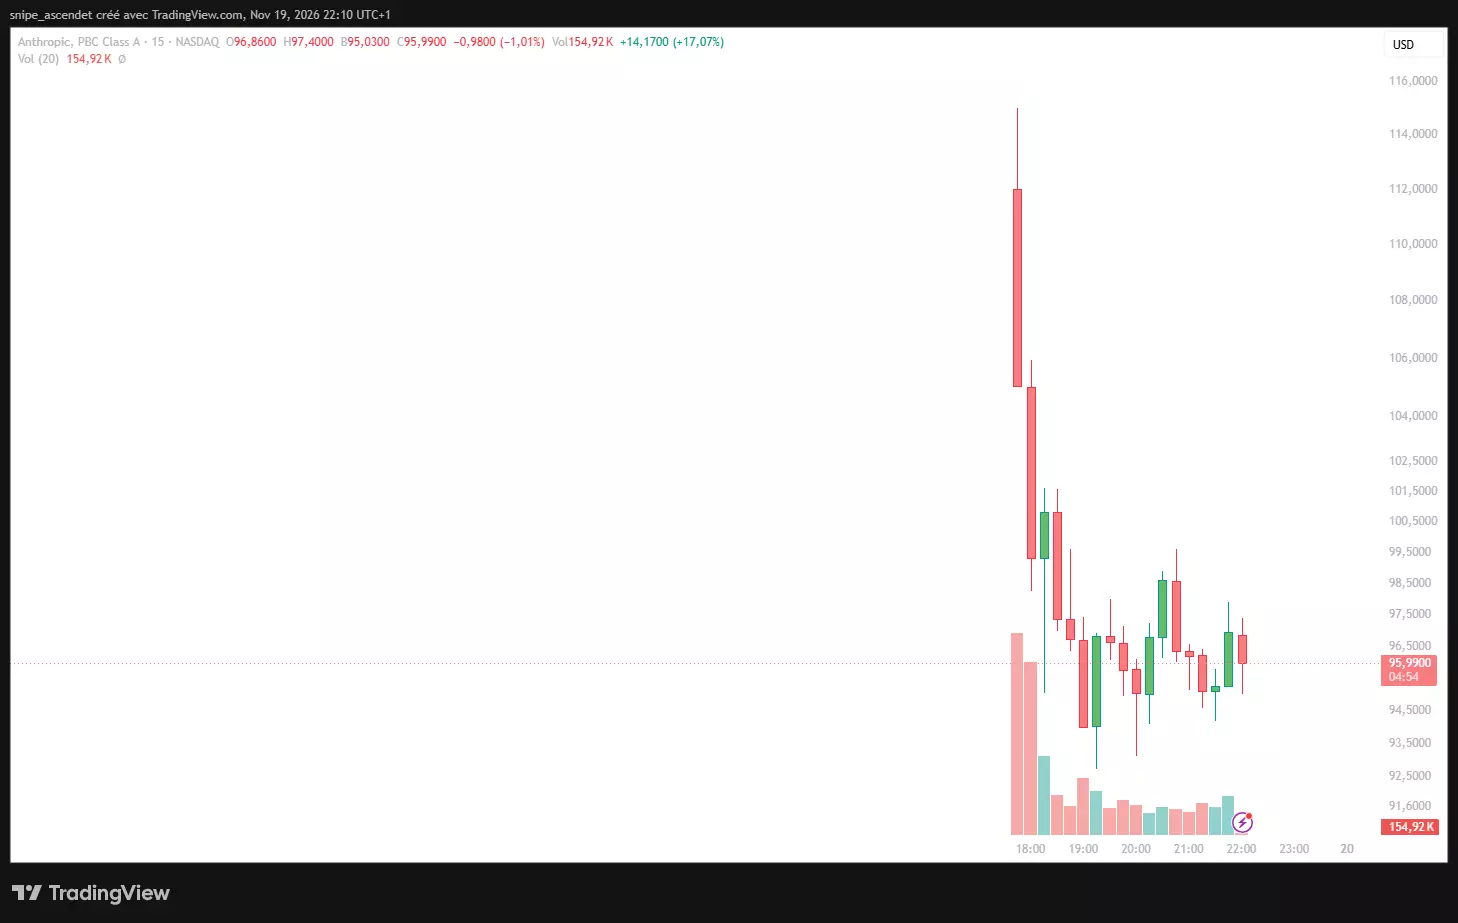
Anthropic’s pricing announcement confirmed an $83 offer price for 980 million Class A shares, giving the public offering a gross size of $81.34 billion. The developer of Claude began trading on Nasdaq under the ANT ticker, opening at $111.50, or 34.34% above the offer price, according to Reuters.
Early enthusiasm carried the stock above $115, temporarily pushing its quoted equity valuation past $2 trillion. The stock subsequently retreated to about $95.99 around 4:10 p.m. ET. That remained approximately 15.65% above the IPO price but was 13.91% below the opening trade. The distinction matters: a first-day gain for IPO subscribers can coexist with losses for investors who bought at the market open.
Anthropic’s success in raising capital reflects investor demand for exposure to frontier AI models. It does not automatically validate the valuations of chipmakers, data-center operators, cloud infrastructure suppliers or other companies with very different cash-flow profiles. One explanation raised by investors is portfolio reallocation: demand for a large new listing may coincide with sales of existing holdings, rather than adding net buying power to the market. Business Insider reported this interpretation from market observers.
Nvidia, AMD and AI infrastructure stocks deepen the pressure
The selloff spread through the semiconductor ecosystem. Nvidia (NASDAQ: NVDA) erased an early gain and extended its losing streak despite an upbeat revenue outlook. Micron (NASDAQ: MU) and Broadcom (NASDAQ: AVGO) also weakened, while data-center infrastructure companies CoreWeave (NASDAQ: CRWV) and Nebius (NASDAQ: NBIS) remained under pressure, according to Reuters.
AMD (NASDAQ: AMD) faced a separate company-specific catalyst after Hunterbrook reported allegations involving chip sales to China and its affiliated investment fund disclosed a short position. Allegations are not a regulatory finding or a legal conclusion. For investors, the wider implication is that geopolitical restrictions and compliance risk have become another variable in chip-sector valuations.
For the AI complex, three questions now dominate: how quickly customers can monetize expensive computing capacity, whether future capital expenditures will generate acceptable returns, and how much debt or other financial commitments are needed before those returns arrive. Revenue growth alone cannot settle these questions when interest costs and investment requirements are rising.
QQQ falls below its 200-day and 300-day averages
The Invesco QQQ Trust (NASDAQ: QQQ), a widely followed fund tracking the Nasdaq-100, stood near $645.09, down about 2.19% on Thursday. Its 200-day moving average was near $682.01, putting the ETF approximately 5.41% below its long-term trend line. It was also nearly 1.98% under its 300-day average around $658.15.
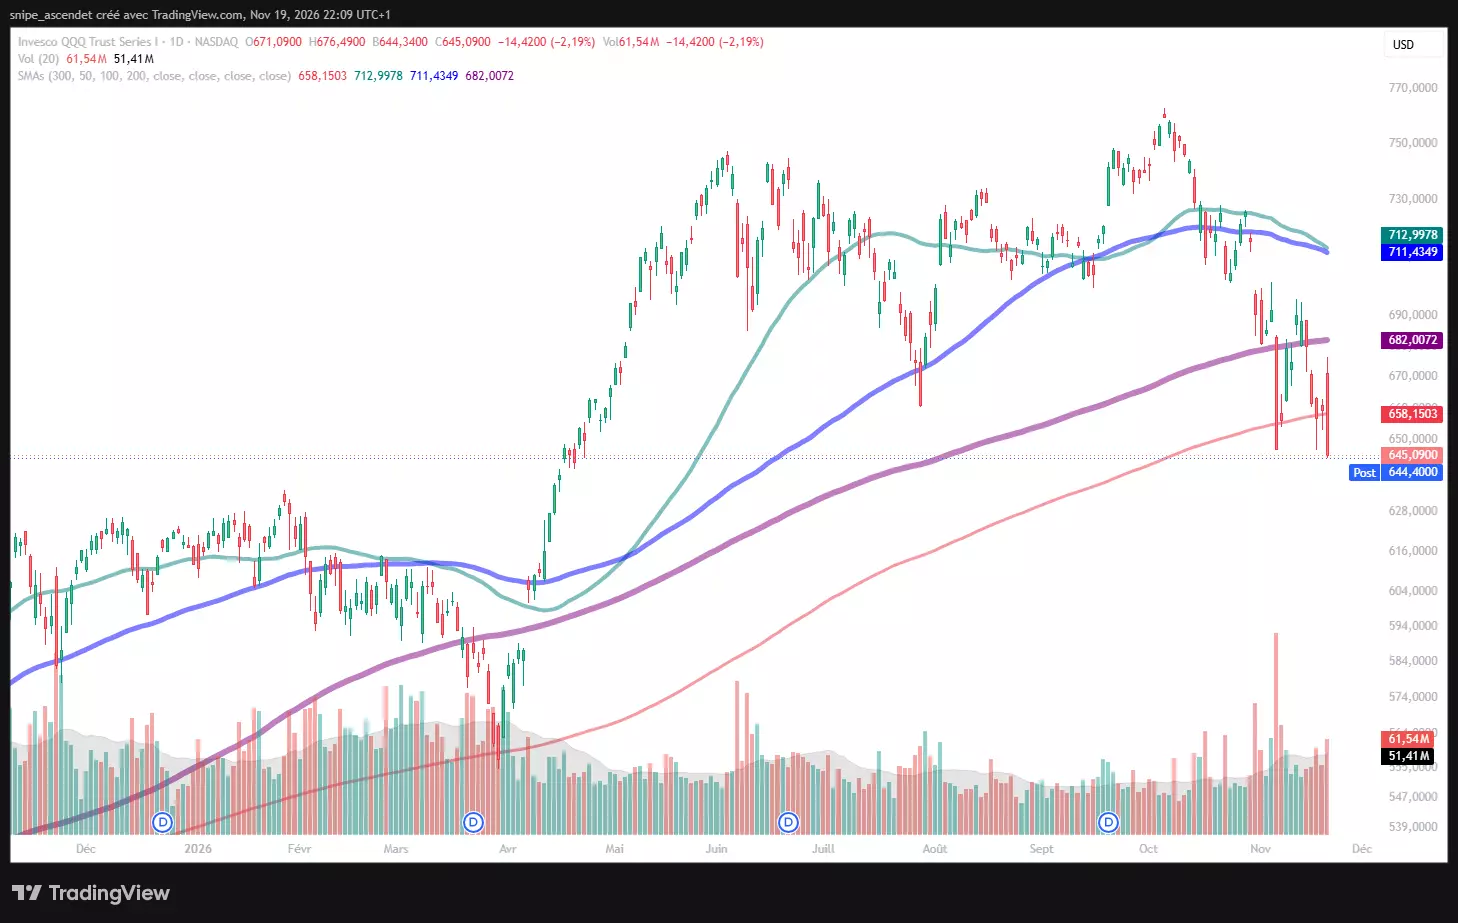
The difference between the S&P 500 and QQQ is telling. The S&P 500 was still marginally above its 300-day average at the close, while QQQ had already broken below that slower trend measure. That divergence is consistent with concentrated pressure on growth stocks whose valuations depend heavily on future profits. A strong market recovery would likely require more than a one-day bounce in a single AI name.
The Fed is adding a second problem for growth-stock valuations
The Federal Reserve’s minutes from its October 27-28 meeting, released November 18, offer a crucial explanation for the broader repricing. Policymakers kept the federal funds target range at 3.75%-4.00% at that meeting, with two officials favoring an immediate quarter-point increase. Almost all participants judged that further tightening would likely be appropriate under their baseline economic outlooks.
Reuters reported that futures markets assigned roughly a 94% probability to a 25-basis-point increase at the December 8-9 meeting, versus about 6% for a 50-basis-point move. Those probabilities can change with incoming inflation and employment data. The next personal consumption expenditures inflation report is a particularly important catalyst.
Higher interest rates matter because they lift financing costs for the businesses building AI infrastructure and increase the discount rate investors apply to profits expected far into the future. Both mechanisms can compress equity valuations even when current quarterly revenue remains strong.
There is another notable finding in the minutes: almost all Fed participants discussed risks from disappointing returns on AI investment, and most observed that AI-related debt had expanded rapidly, often through complex financing structures. The central bank was considering the possibility that an AI valuation reset could transmit stress through credit markets as well as public equities. The intersection of monetary tightening and AI financing is therefore a more consequential issue than Thursday’s IPO price alone.
Gold falls to a 14-month low, while silver also loses ground
The selling pressure was not restricted to stocks. Gold traded around $3,658.93 per troy ounce late Thursday, roughly 1.78% lower on the daily price series, while silver was near $43.73, down about 2.60%. Both markets had already retreated sharply from peaks earlier in 2026.
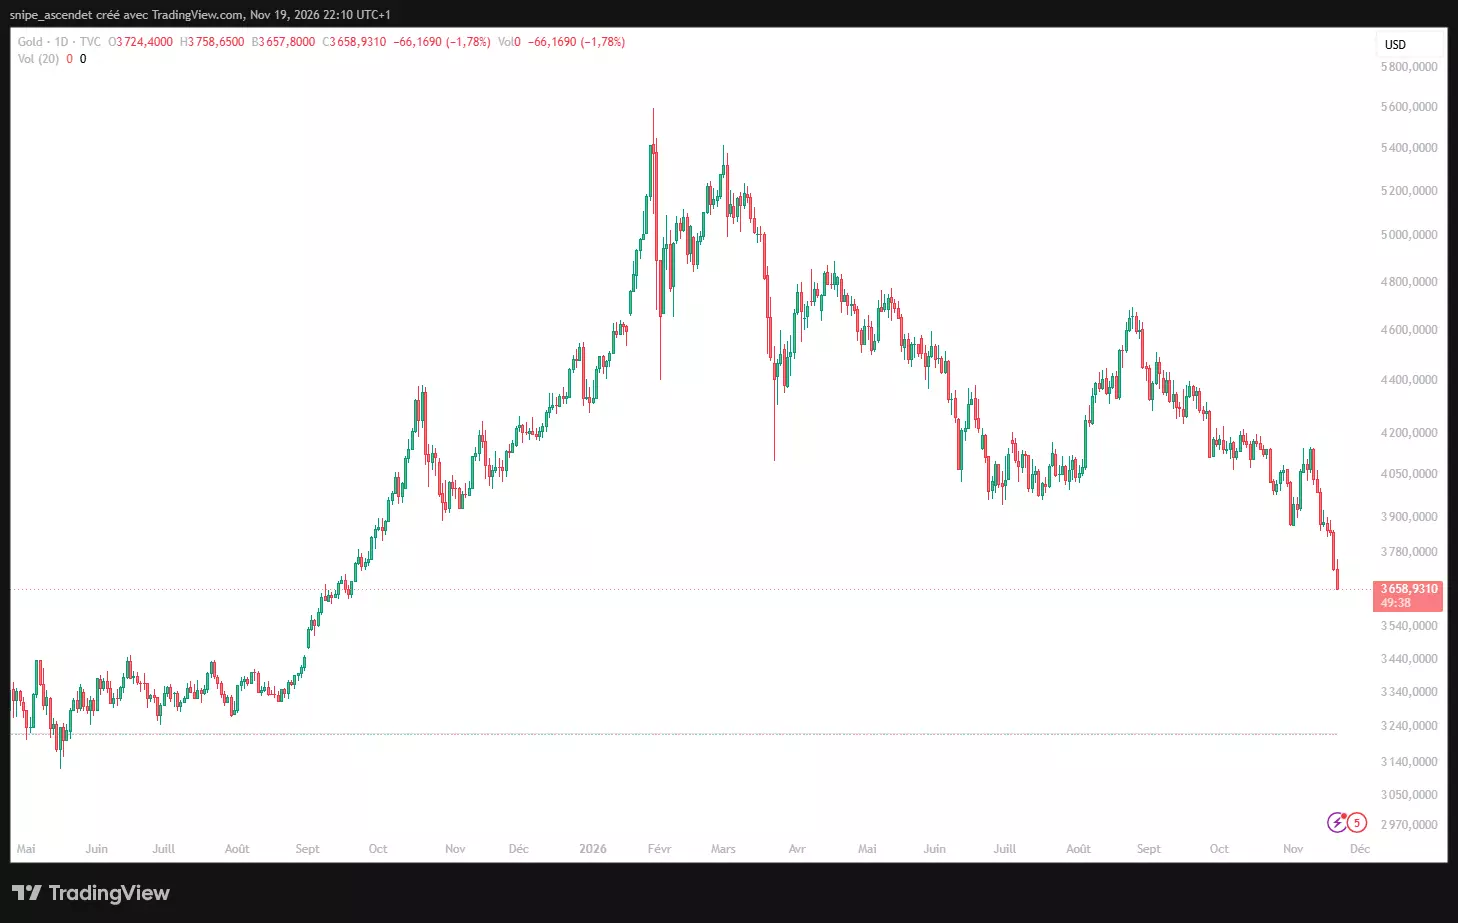
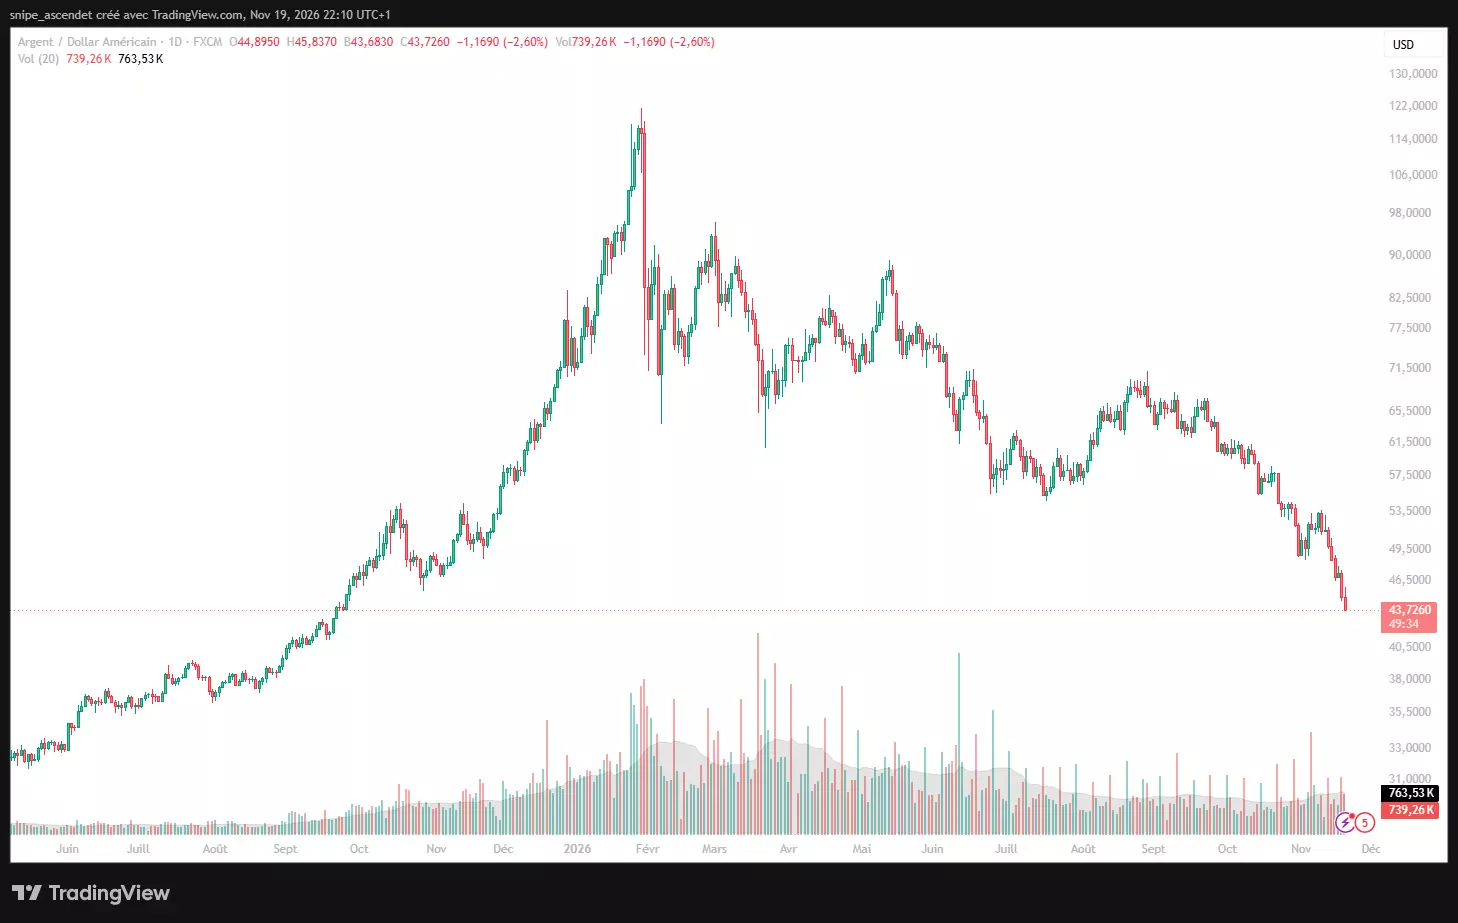
Reuters reported spot gold at $3,674.13 and spot silver at $44.34 as of 2:05 p.m. ET, with gold reaching its weakest level since September 2025. The differences from later price readings reflect the time and market series observed. A stronger dollar and expectations of higher U.S. rates weighed on non-yielding metals, while broad selling pressure may have contributed to simultaneous declines in several assets.
For portfolio construction, Thursday illustrates that gold and silver are not automatic one-day hedges against equity losses. Their behavior depends on real yields, the dollar, liquidity and investor demand. Silver also carries industrial-demand sensitivity, which can make it especially volatile when growth expectations deteriorate.
The Iran conflict remains a risk for oil, inflation and corporate margins
The comparison with the March-April selloff is more than technical. Attacks and shipping disruption around the Strait of Hormuz continue to complicate the global energy outlook. Reuters reported that Brent crude settled at $91.98 a barrel and U.S. West Texas Intermediate at $83.21 on November 19, little changed on the day as disruption risk was balanced by worries about surplus supply.
Persistently expensive energy can raise transport, manufacturing and data-center operating costs while making the Fed’s inflation task more difficult. The market is therefore absorbing two related pressures: a large AI capital-spending cycle and geopolitical risks that may limit how quickly interest rates can fall. The exact drivers of the next equity move will depend on earnings, incoming inflation data and the course of the conflict.
What investors should watch after the 200-day breakdown
- 7,163 on the S&P 500: The approximate 300-day average, now the nearest major long-term trend reference.
- 7,000-7,100: Psychological downside watch zones if selling continues; not proven floors.
- 7,348: The 200-day average, now a key level to reclaim before a technical recovery looks more durable.
- QQQ near $658 and $682: Its 300-day and 200-day averages, respectively, which show whether large-cap technology is rebuilding momentum.
- December 8-9 Fed meeting: Rate expectations, the next PCE inflation report and signals about AI financing conditions.
- Market breadth and earnings revisions: A rebound supported by many sectors and stable forecasts would be more persuasive than another narrow IPO-led rally.
There are competing paths forward. A stabilization in yields and better-than-feared earnings could help stocks recover the broken averages; another downgrade to AI spending assumptions or higher inflation could extend the drawdown. The near-term technical risk is elevated, but neither a bear market nor a quick rebound is predetermined.
Bottom line
The S&P 500’s retreat below its 200-day moving average is no longer an isolated chart event. Thursday combined a broad 2% market decline, a fading Anthropic debut, falling technology shares, lower precious metals and a Federal Reserve still focused on inflation. For shareholders, the next test is whether the index can hold near its 300-day average and whether AI earnings and financing expectations stabilize enough to support a wider recovery.
Data as of 4:10 p.m. ET, November 19, 2026. For informational purposes only; not investment advice.