

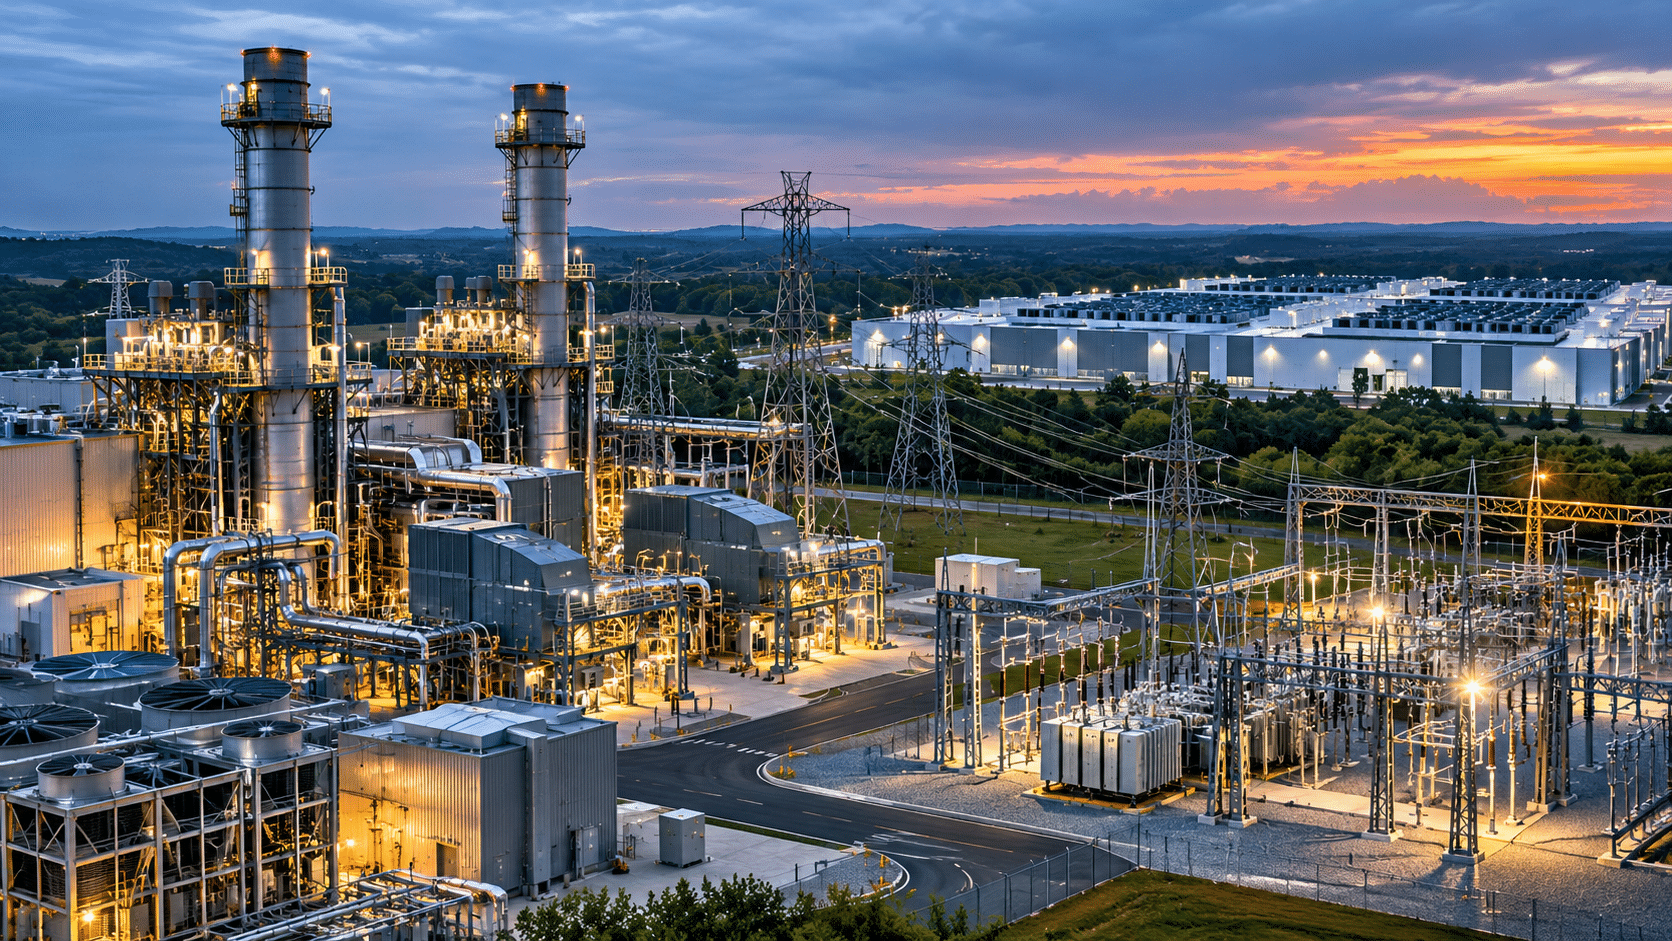
AI electricity demand is accelerating, but power stocks are not all benefiting in the same way. GE Vernova reported $5.4 billion in third-quarter 2026 free cash flow, Bloom Energy more than doubled quarterly revenue while using cash, and Vistra lifted its adjusted cash-flow outlook on November 6. Selling electricity infrastructure, manufacturing onsite power systems and operating generating plants are three different ways to monetize the AI buildout. The fastest growth does not necessarily produce the strongest cash return.
The timing is significant. At the November 6 close, GE Vernova (NYSE: GEV) stood at $774.11, up 0.47% for the session; Bloom Energy (NYSE: BE) finished at $173.24, up 3.41%; and Vistra (NYSE: VST) rebounded 10.55% to $124.80. All three remained volatile after a sharp early-November repricing. These are final regular-session closes, not intraday indications.
Power Demand Is Real, but AI Does Not Guarantee Higher Profits
The International Energy Agency’s latest energy-and-AI assessment projects that global data-center electricity use will rise from roughly 485 terawatt-hours in 2025 to 950 TWh by 2030. The agency also warns that grid connections, equipment supply and other bottlenecks constrain how quickly projects can be built. In the United States, the Energy Information Administration’s September 2026 outlook linked stronger commercial and industrial power use partly to data centers and manufacturing, while expecting electricity sales to rise by almost 2% in 2026 and another 2% in 2027.
The implication is not a uniform sector-wide boom. Equipment makers can collect orders and customer advances years before a plant enters service. Onsite power suppliers can gain contracts yet spend heavily on factories, inventories and installation. Generators can benefit from higher demand only if contracts, fuel costs, regulation and local power prices produce attractive margins. Investors need to track both the growth pipeline and how quickly each company’s economics turn into cash.
GE Vernova: The Clearest Reported Cash Flow, With a Working-Capital Caveat
GE Vernova’s October 28 results showed third-quarter revenue of $12.642 billion, up 27% year over year, and adjusted EBITDA of $1.943 billion, a 15.4% margin. Its Power division delivered $6.067 billion in revenue and a 21.4% segment EBITDA margin. Orders reached approximately $29.3 billion, while total remaining performance obligations, described by the company as backlog, increased to $197 billion. Gas Power equipment backlog plus slot reservation agreements totaled 122 gigawatts.
Cash generation looks even more compelling on the surface: operating cash flow was $6.057 billion, and company-defined free cash flow was $5.409 billion in the quarter. Management raised full-year 2026 free cash flow guidance to $16 billion-$17 billion and revenue guidance to $46.5 billion-$47.5 billion. It also reported $16.8 billion in cash at September 30 and announced an expansion of its share repurchase authorization to $20 billion.
There is an important qualification. GE Vernova explicitly attributed much of the quarterly cash-flow increase to favorable working-capital movements, alongside better earnings. Customer deposits and milestone payments can make near-term operating cash flow much stronger than underlying annual profit conversion. Such advances still have value, but they are associated with future delivery obligations. Investors should not extrapolate the $5.4 billion quarter as a repeatable quarterly run rate without examining the contract cycle.
GE Vernova also plans substantial investment: it said third-quarter capital expenditures were about $0.6 billion and described a $6 billion multiyear capital-expenditure program from 2025 through 2028. Its Wind business remained challenged, with management forecasting a $400 million-$500 million segment EBITDA loss for 2026. The stronger Power and Electrification divisions support the thesis, but the group is not a pure data-center play. For comparison, DualFinances’ analysis of Lam Research’s buyback explores how capital returns must be weighed against an equipment supplier’s cyclical investment needs.
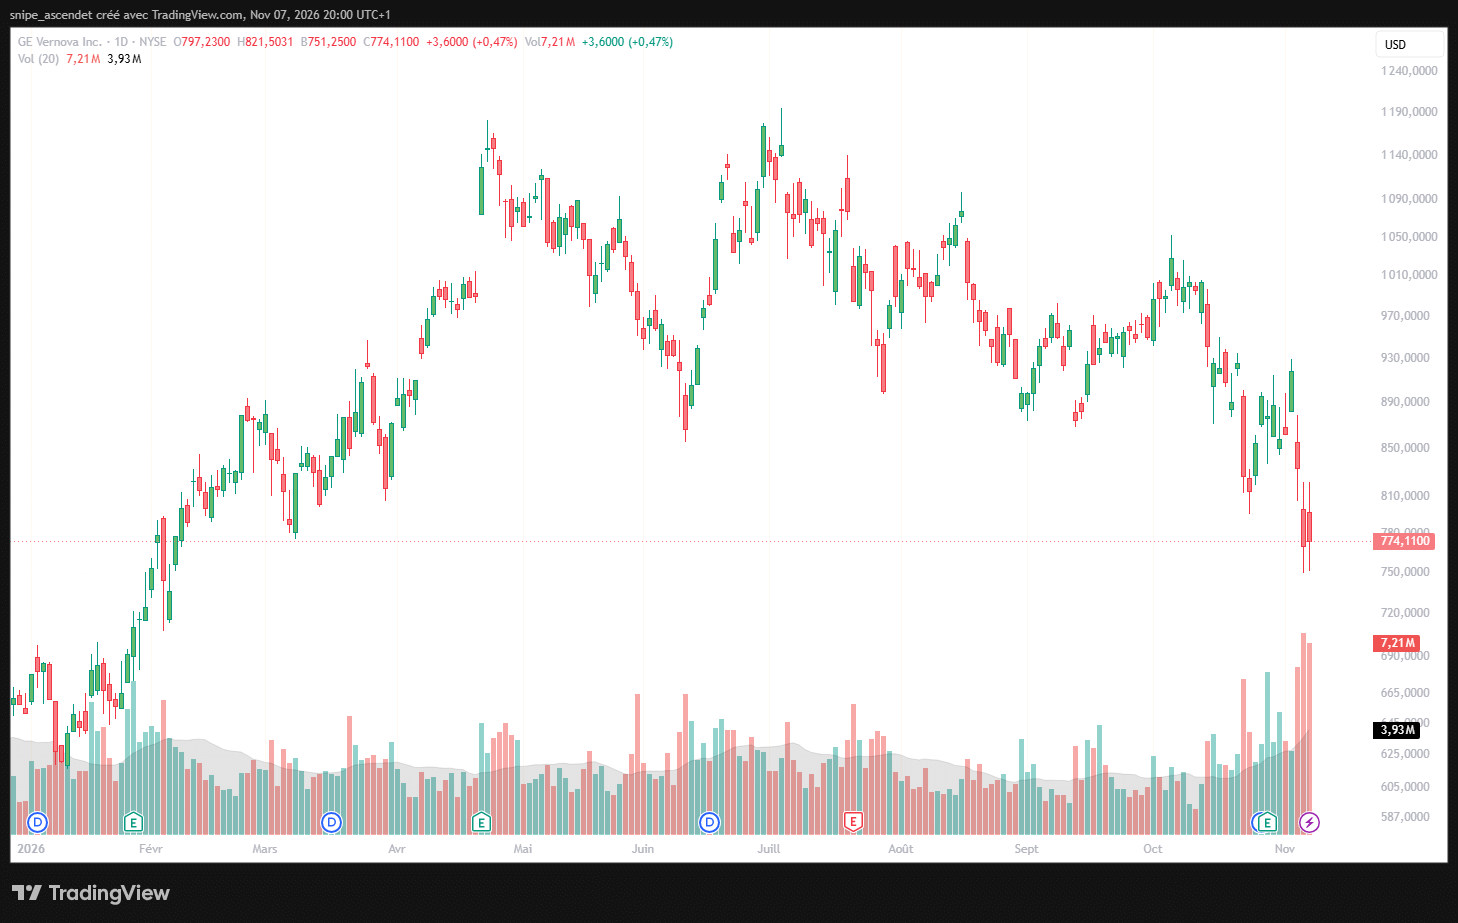
The chart makes the valuation risk visible. GEV was up just 0.47% on November 6 despite a wide $751.25-$821.50 trading range and roughly 7.21 million shares traded. After its early-November decline, the stock remained substantially below its October trading levels. Improving business performance and short-term share-price performance are not interchangeable.
Bloom Energy: Explosive Sales, but Cash Flow Still Lags
Bloom Energy’s October 22 earnings release recorded $1.236 billion in third-quarter revenue, up 138.1% year over year. GAAP operating income climbed to $225.4 million, gross margin reached 33.8%, and diluted GAAP earnings were $0.78 per share. Management raised 2026 revenue guidance to $4.4 billion-$4.6 billion, with roughly 34% non-GAAP gross margin expected for the year.
Bloom’s business case differs fundamentally from GE Vernova’s: it manufactures solid-oxide fuel-cell systems that produce electricity on site, potentially shortening the wait for utility-grid connections. On November 5, NTT DATA announced an agreement to deploy 900 megawatts of Bloom onsite power across multiple data-center projects globally, with initial shipments expected in 2027. But a megawatt commitment is not yet recognized revenue or collected cash.
The cash statement shows the execution challenge. During the third quarter, Bloom reported negative $27.1 million in operating cash flow and $153.5 million of property, plant and equipment purchases. Subtracting those purchases gives approximately negative $180.6 million in conventional free cash flow, calculated here as operating cash flow minus capital expenditures. Contract assets, inventories and receivables absorbed substantial cash even as earnings improved; customer deposits and payables partly offset those uses. At September 30 Bloom held approximately $2.49 billion in cash and equivalents, but also reported $2.47 billion of recourse debt and material other obligations.
That gap does not prove the business model is unsound. Scaling production often consumes working capital before customers pay. But Bloom’s investment case depends on turning contracted megawatts and reported operating profits into repeatable positive free cash flow, without excessive dilution or financing costs. Using the November 6 close and 295.5 million shares outstanding as of September 30, its indicative equity value was about $51.2 billion, roughly 11.4 times the midpoint of 2026 revenue guidance. This is equity value to sales, not an enterprise-value multiple; the share count may have changed.
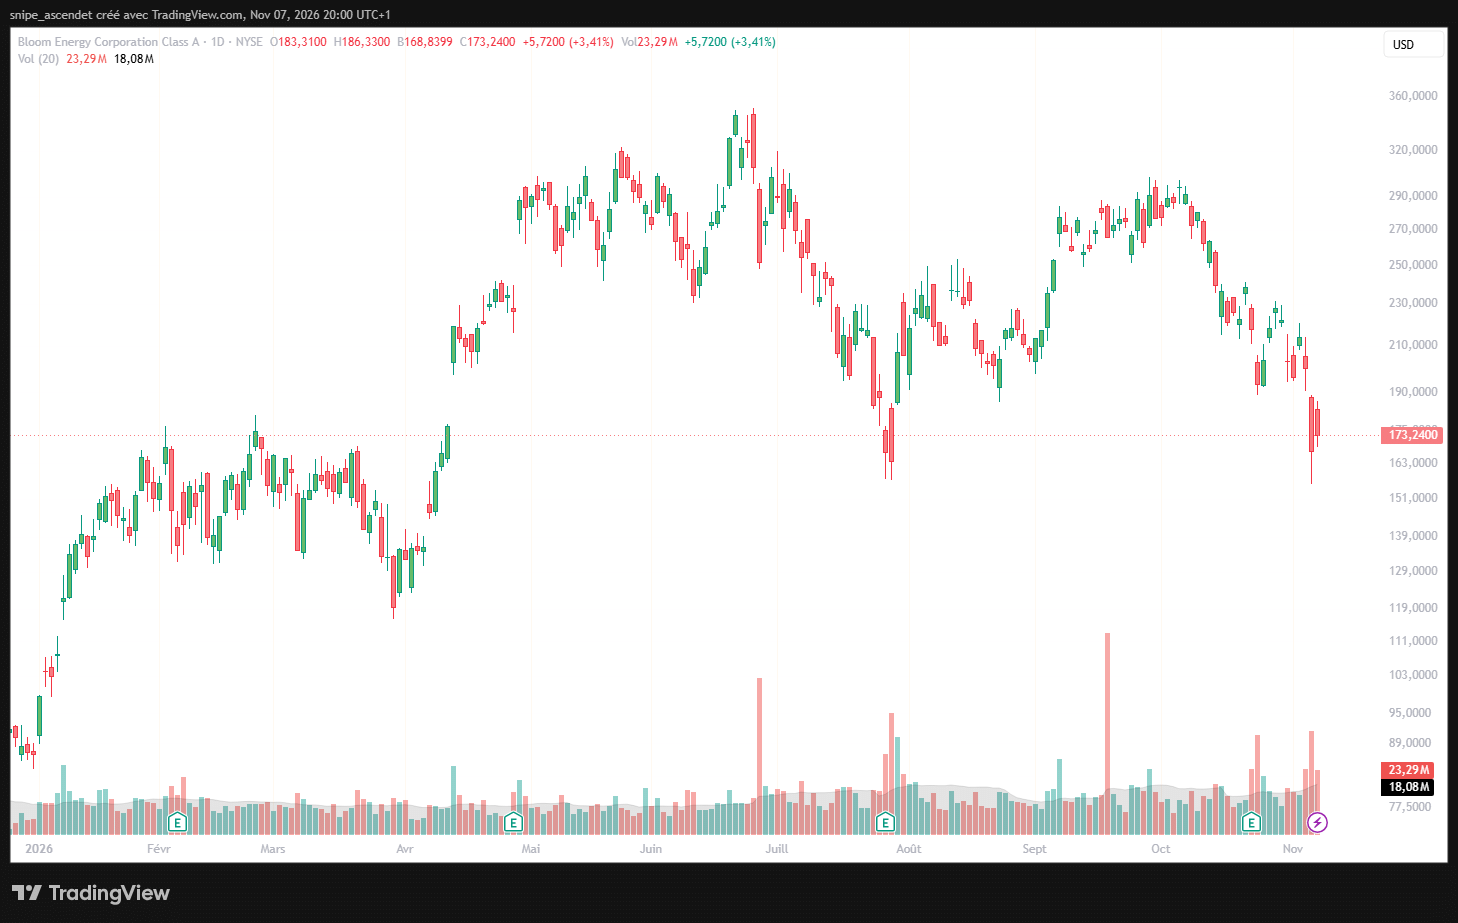
Bloom gained 3.41% on November 6, but its $173.24 close remained below the $203.17 October 30 close. Volume of approximately 23.29 million shares was above the 20-session volume average shown on the chart. The price action illustrates how an impressive growth story can still be vulnerable when investors demand evidence of cash conversion.
Vistra: Established Generation and Strong Adjusted Cash Guidance
Vistra’s November 6 report provides the clearest evidence of earnings being generated by an existing power fleet. Third-quarter net income was $1.140 billion, although this included a $559 million unrealized hedging gain. Ongoing Operations Adjusted EBITDA reached $2.378 billion, compared with $1.581 billion a year earlier, an increase of about 50%. Management attributed the improvement partly to higher realized energy and capacity prices, acquired plants and the return to service of an existing unit, not simply to new AI demand.
Vistra narrowed 2026 adjusted EBITDA guidance to $7.1 billion-$7.5 billion and guided to $4.3 billion-$4.7 billion in Ongoing Operations Adjusted Free Cash Flow before Growth (FCFbG). Its initial 2027 outlook called for $7.7 billion-$8.5 billion of adjusted EBITDA and $4.3 billion-$5.1 billion of adjusted FCFbG. These are management’s non-GAAP measures. FCFbG excludes certain working-capital movements and distinguishes maintenance investment from growth spending, so it is not directly comparable to the free cash flow calculated for Bloom or reported by GE Vernova.
Vistra’s commercial evidence is tangible. It cited the opening of a 405 MW Illinois solar project contracted to Microsoft, a 20-year agreement for 207 MW at its Odessa gas plant, and its October acquisition of Cogentrix assets representing about 5,500 MW of gas generation. The deals expand potential earnings capacity but also require capital and integration. Pro forma available liquidity stood at approximately $5.4 billion after acquisitions, debt actions and preferred-stock redemption, down from $8.9 billion as of September 30 on the company’s stated basis.
Regulatory exposure is now central. Following the November elections, Texas data-center connection and permitting policy became more uncertain. In Reuters’ November 6 reporting, Vistra said it had not observed large customers abandoning Texas for PJM and remained in discussions for new power-purchase agreements. Demand may persist, but permitting delays, customer-funded infrastructure rules and wholesale price changes could alter what Vistra ultimately earns. Management also reported hedging approximately 98% of expected 2027 generation volumes as of October 30, providing near-term price visibility while limiting some upside from spot-price strength.
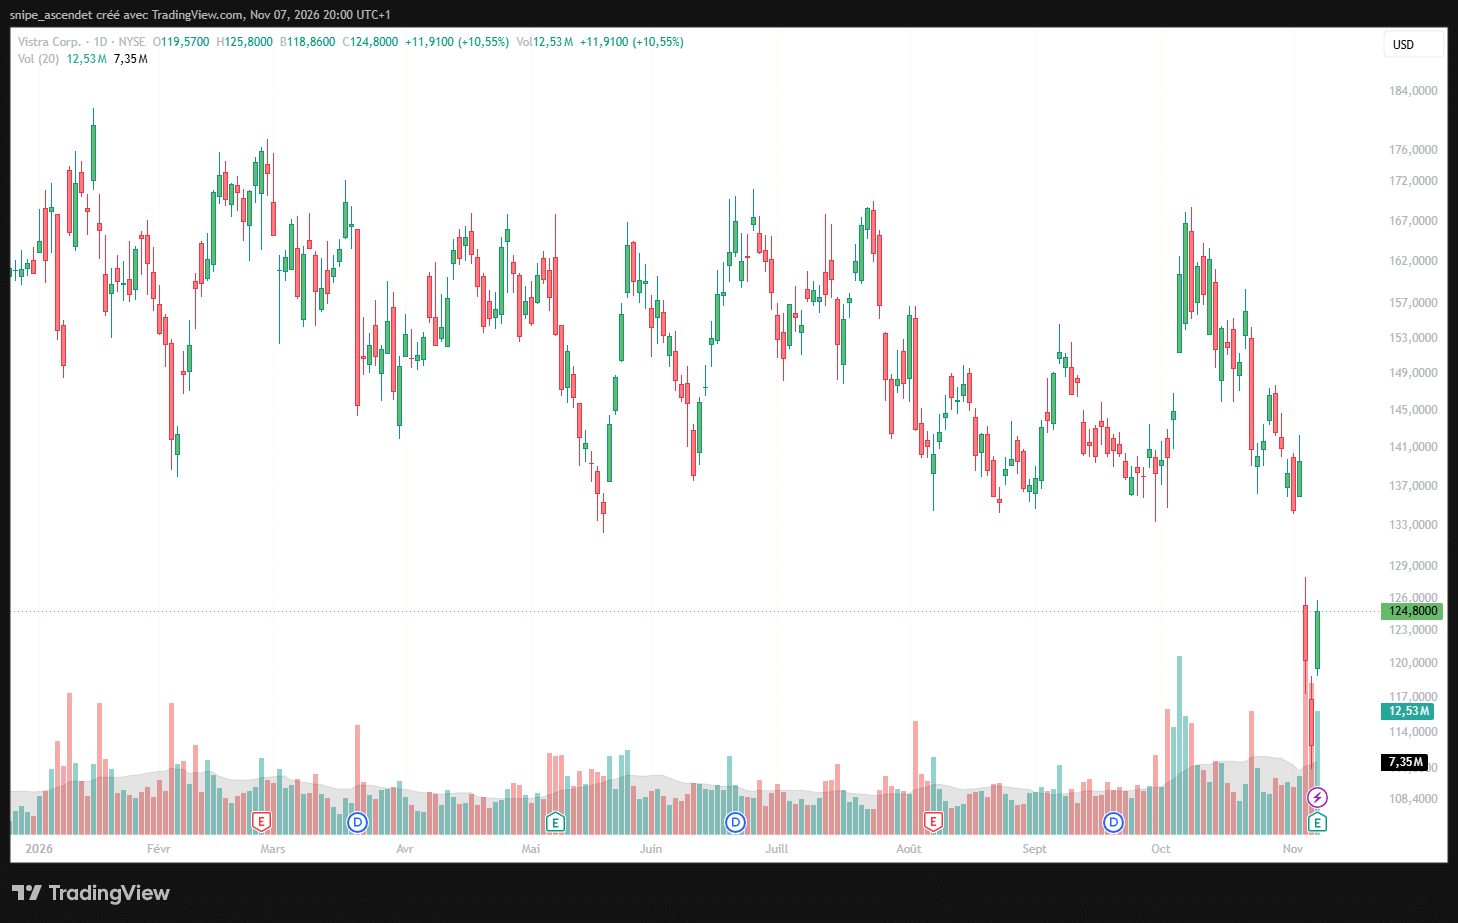
VST surged 10.55% to $124.80 on November 6 with approximately 12.53 million shares traded. Yet its rebound followed substantial losses on November 4 and 5. A positive earnings-day response does not erase the policy and valuation risk that had already been reflected in the price.
GEV vs. BE vs. VST: What the Cash-Flow Numbers Actually Mean
| Metric | GE Vernova (GEV) | Bloom Energy (BE) | Vistra (VST) |
|---|---|---|---|
| Q3 2026 operating evidence | $12.64B revenue; +27% YoY | $1.236B revenue; +138.1% YoY | $2.378B ongoing adjusted EBITDA; about +50% YoY |
| Profit measure | $1.943B adjusted EBITDA | $225.4M GAAP operating income | $1.140B GAAP net income, including a $559M unrealized hedging gain |
| Cash-flow evidence | $5.409B Q3 company-defined FCF | About -$180.6M Q3 operating cash flow less property/equipment purchases | $4.3B-$4.7B 2026 adjusted FCF before growth guidance; not ordinary FCF |
| Principal investment test | Convert backlog and advances into durable margins | Turn fast-growing deliveries into positive recurring FCF | Secure attractive power contracts net of debt and growth capex |
These figures should not be ranked as though they were identical accounting measures. GEV and BE show actual third-quarter cash flow, although their free-cash-flow definitions should still be checked against reconciliations. Vistra’s quoted figure is forward, adjusted, before growth spending and tied to ongoing operations. Moreover, the three businesses have different revenue models and balance-sheet demands. As explained in our earlier analysis of earnings quality and cash conversion, accounting profitability can move in a very different direction from cash generation.
What XLU and SPY Say About the Broader Trade
The Utilities Select Sector SPDR Fund (XLU) and SPDR S&P 500 ETF Trust (SPY) provide context rather than clean substitutes for GEV, BE or VST. XLU predominantly holds regulated utilities with different economics from independent generation and electrical equipment manufacturing. SPY is a diversified large-cap benchmark. The weekly screenshots also show different historical starting points, so comparing their full displayed price changes would be misleading. Their common 2026 period is the appropriate visual reference.
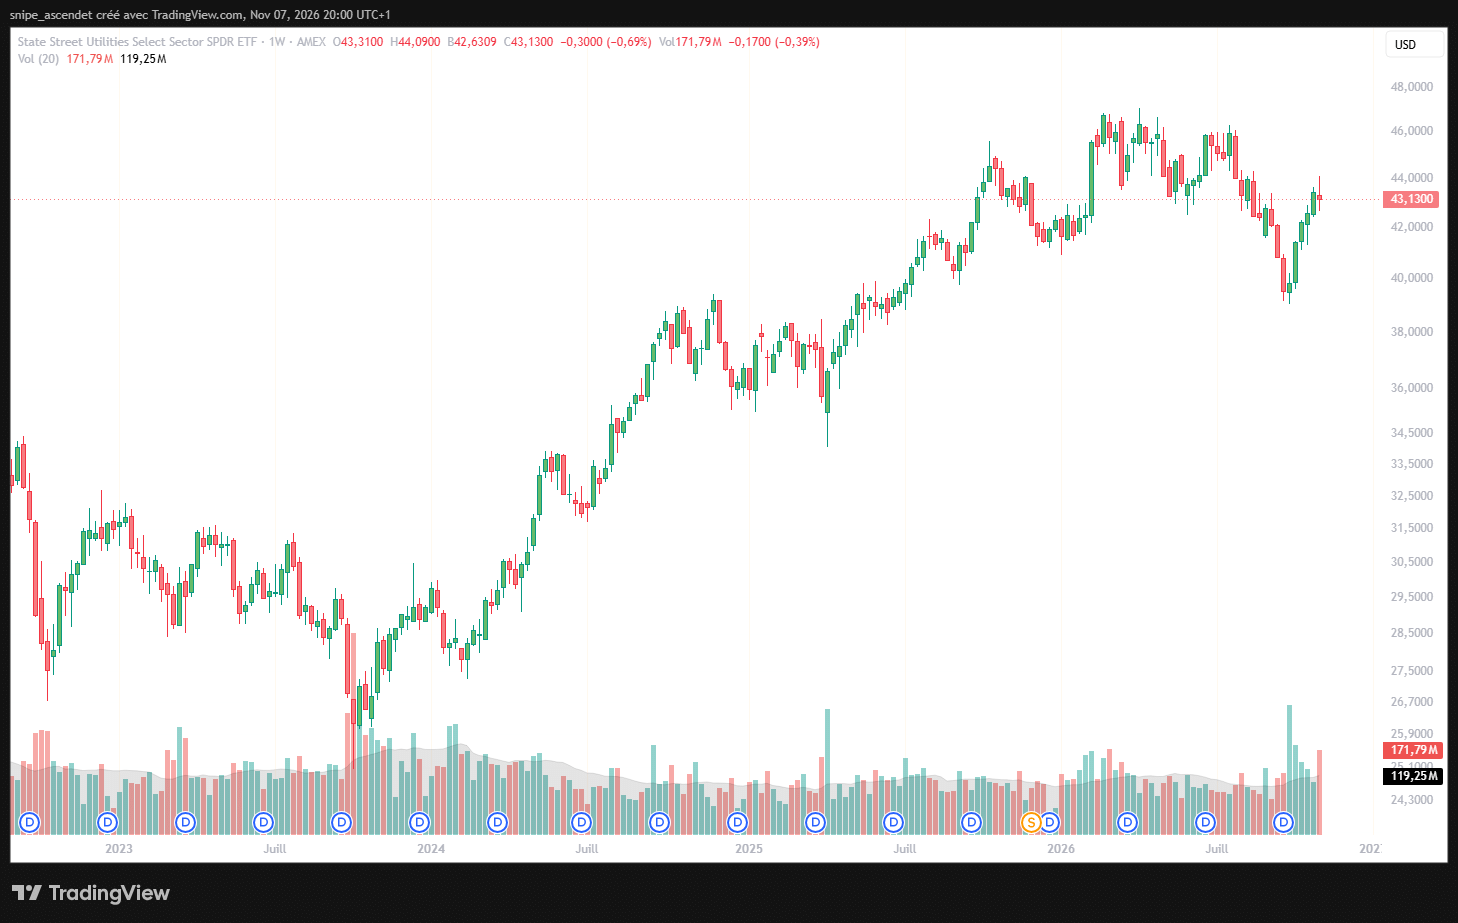
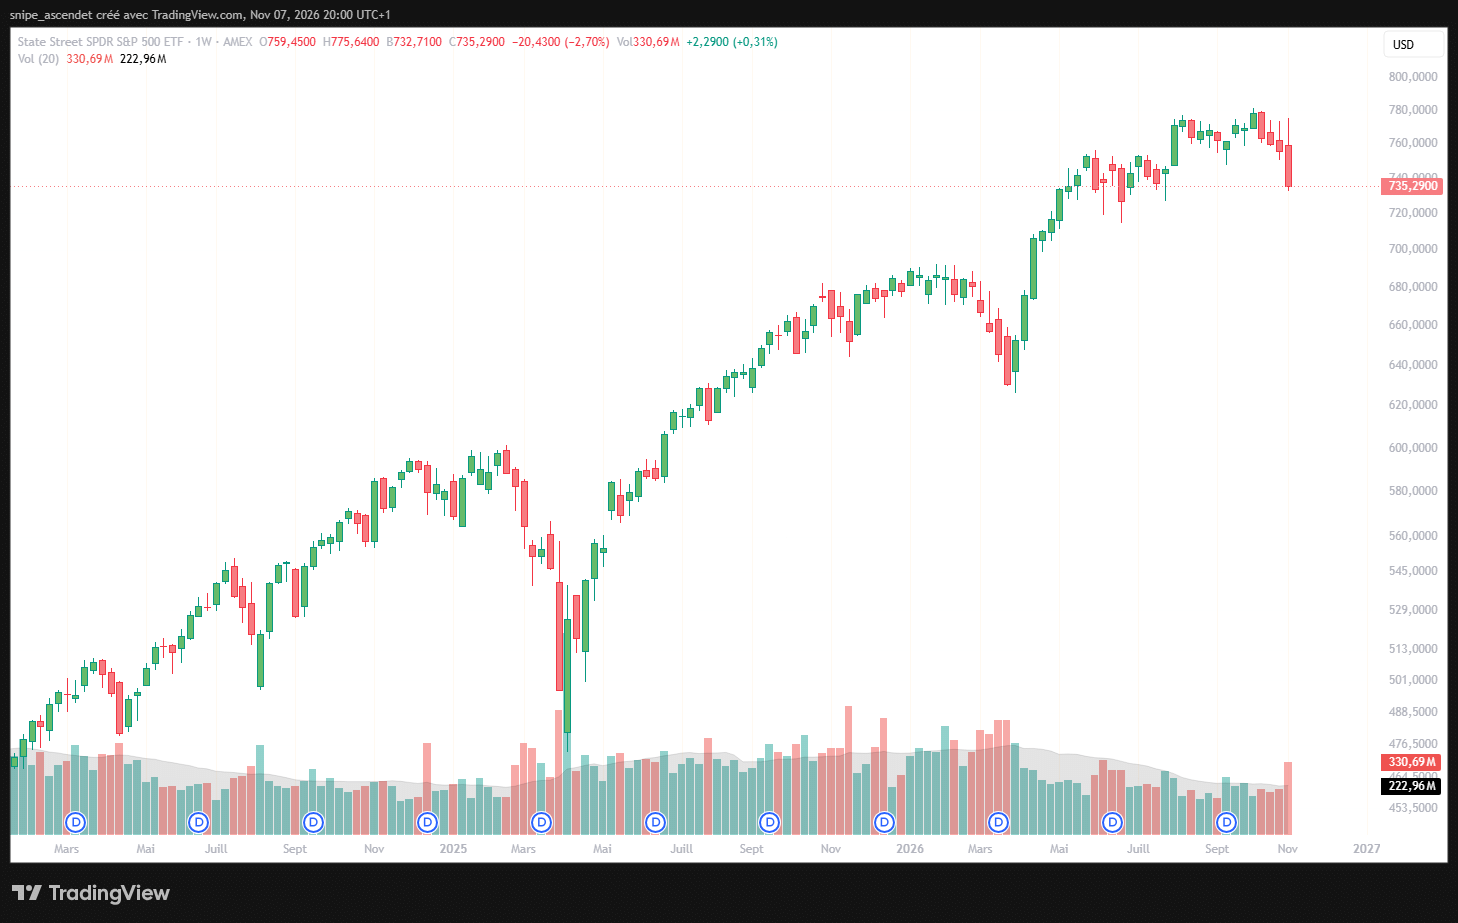
On the completed week ending November 6, the charts show XLU at $43.13, down approximately 0.69% for the week, and SPY at $735.29, down approximately 2.70%. That week’s relative resilience of XLU is not proof that AI power demand drove the difference. Interest-rate expectations, defensive positioning, sector composition and other factors could have mattered. For broader context on market positioning, see our coverage of Wall Street’s fragile technology rebound.
Three Scenarios for Investors
Bull case: Demand converts into contracted, profitable supply
Transmission bottlenecks persist, equipment shortages support GE Vernova’s pricing, Bloom scales manufacture and collections on its data-center projects, and Vistra signs long-duration contracts at attractive returns. Under this scenario all three can benefit, but the valuation gains may be uneven because expectations are already substantial.
Base case: Real growth, uneven cash conversion
Data centers keep expanding but construction schedules slip. GE Vernova’s backlog continues growing while advance payments normalize; Bloom reports more revenue but needs funding for inventory and capacity; Vistra earns attractive operating cash while allocating more funds to acquisitions, interconnections and new generation. This scenario favors scrutiny of quarterly cash statements over annualized order announcements.
Bear case: Delays, lower power prices or cost inflation
Grid approvals slow, local resistance increases, hyperscalers phase projects over longer schedules, or fuel and equipment costs erode margins. Such a shift could pressure GEV’s order conversion, BE’s cash runway and valuation, and Vistra’s realized returns on new capacity. Policy uncertainty in Texas adds an identifiable near-term risk for VST; it does not imply data-center demand must collapse nationwide.
Which AI Power Stock Is Best Positioned to Monetize Demand?
GE Vernova has the strongest reported near-term cash-generation evidence among the three, alongside a large equipment-and-services backlog, although the temporary working-capital benefit should temper forecasts. Vistra offers a more direct route from electricity sales to earnings using existing generation and long-term agreements, but its adjusted FCFbG must be reconciled with growth capital, leverage and regulatory exposure. Bloom Energy offers the fastest reported revenue growth and a concrete data-center deployment agreement, but third-quarter negative free cash flow and a high sales multiple leave less room for execution mistakes.
The decisive checkpoints over the next several quarters are GE Vernova’s cash conversion excluding unusual advance-payment inflows, Bloom’s operating cash flow as 2027 projects ramp, and Vistra’s growth-capex requirements and signed power-contract economics. The AI electricity thesis is supported by demand projections. Whether these three stocks become durable winners depends on measurable incremental cash returns, not electricity-demand headlines alone.