


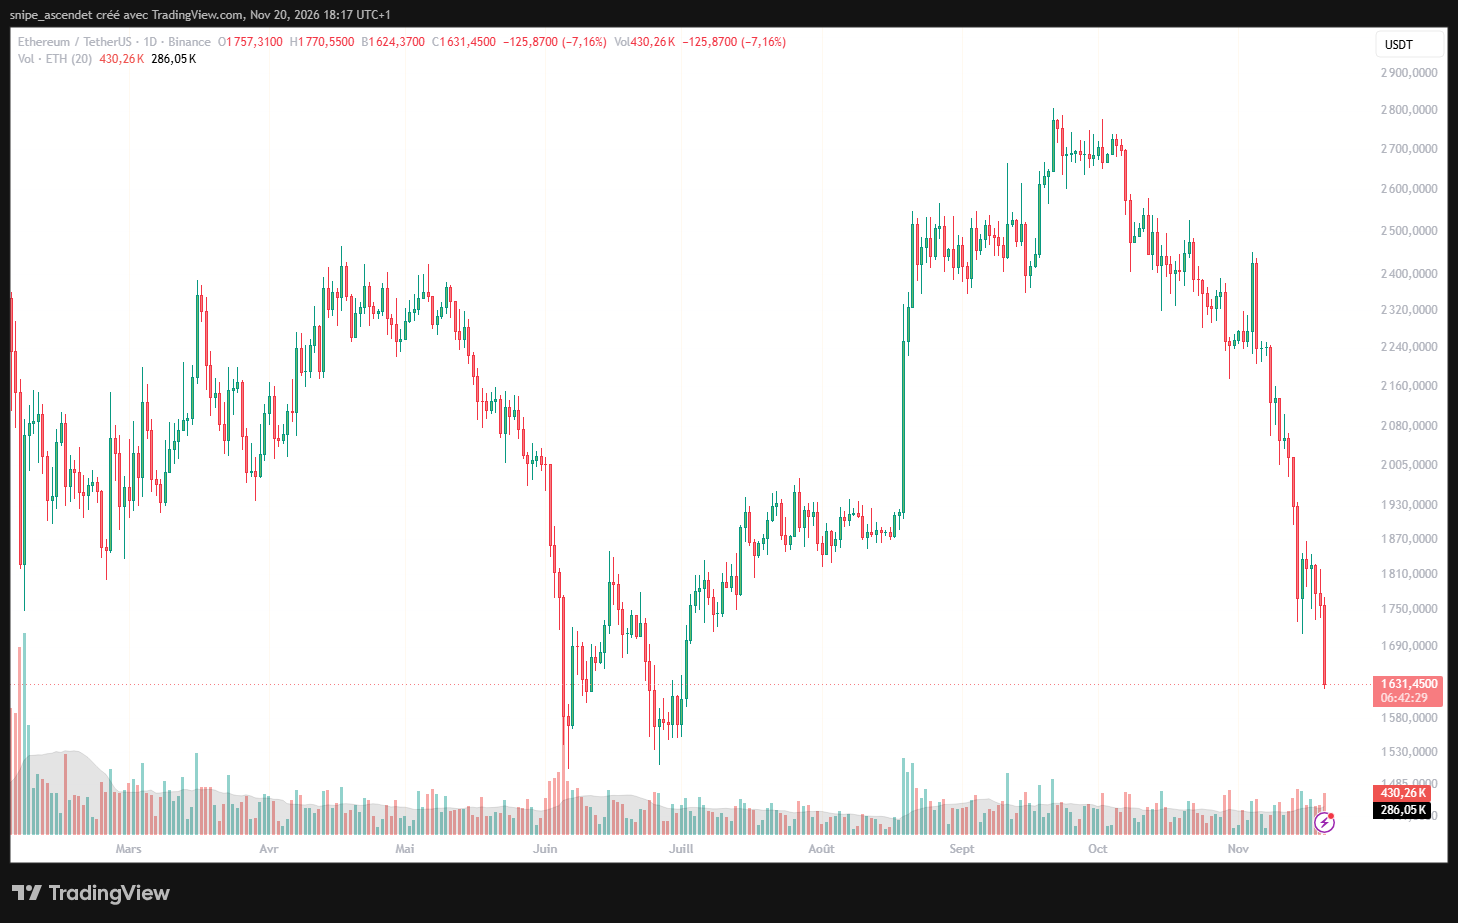
Update, Nov. 20, 12:19 p.m. ET: Bitcoin fell to $59,253.72 at 12:17 p.m. ET on Friday, November 20, 2026, a 4.30% daily decline on Coinbase and its first move below $60,000 since July, according to Reuters. Ether dropped 7.16% to 1,631.45 USDT, while gold lost 2.55% to $3,532.76 per ounce and silver fell 3.77% to $41.117 per ounce in the latest readings. For investors, the issue is no longer a single weak crypto session: the simultaneous slide in speculative tokens, precious metals and technology shares suggests a broader repricing of risk and liquidity.
How Far Have Bitcoin, Ether, Gold and Silver Fallen Since November 19?
The selling accelerated after Thursday’s decline. The comparison below uses the November 19 reference quotes at approximately 4:40 p.m. ET and the November 20 intraday readings around 12:17-12:19 p.m. ET; these percentage changes are distinct from each asset’s daily performance on Friday.
| Asset | Nov. 19 reference | Nov. 20 reading | Change between readings |
|---|---|---|---|
| Bitcoin, USD | $61,443.79 | $59,253.72 | -3.56% |
| Ether, USDT | 1,739.10 | 1,631.45 | -6.19% |
| Gold, USD/oz | $3,625.80 | $3,532.76 | -2.57% |
| Silver, USD/oz | $42.863 | $41.117 | -4.07% |
Ether and silver lost more than Bitcoin and gold over these particular intervals. That is consistent with investors cutting exposure to more volatile positions, although the four prices alone cannot establish whether selling came from margin calls, redemptions or discretionary portfolio decisions.
Why Did Bitcoin Fall Below $60,000?
Bitcoin’s latest daily candle showed an intraday low of $58,678.48 before recovering to $59,253.72 at 12:17 p.m. ET. The breach of $60,000 matters because the round-number area was a visible reference for traders and because Reuters reported that Bitcoin had not traded below it since July. The move follows Bitcoin’s decline earlier in November, rather than representing an isolated Friday shock.
The chart now puts $58,678, Friday’s observed session low, ahead of the broader $57,000-$58,000 area visible around the late-June trough. On the upside, $60,000 is the first level bulls would need to reclaim; the former $62,000-$65,000 trading region becomes a more substantial recovery test. These are price reference zones, not forecasts or guaranteed floors.
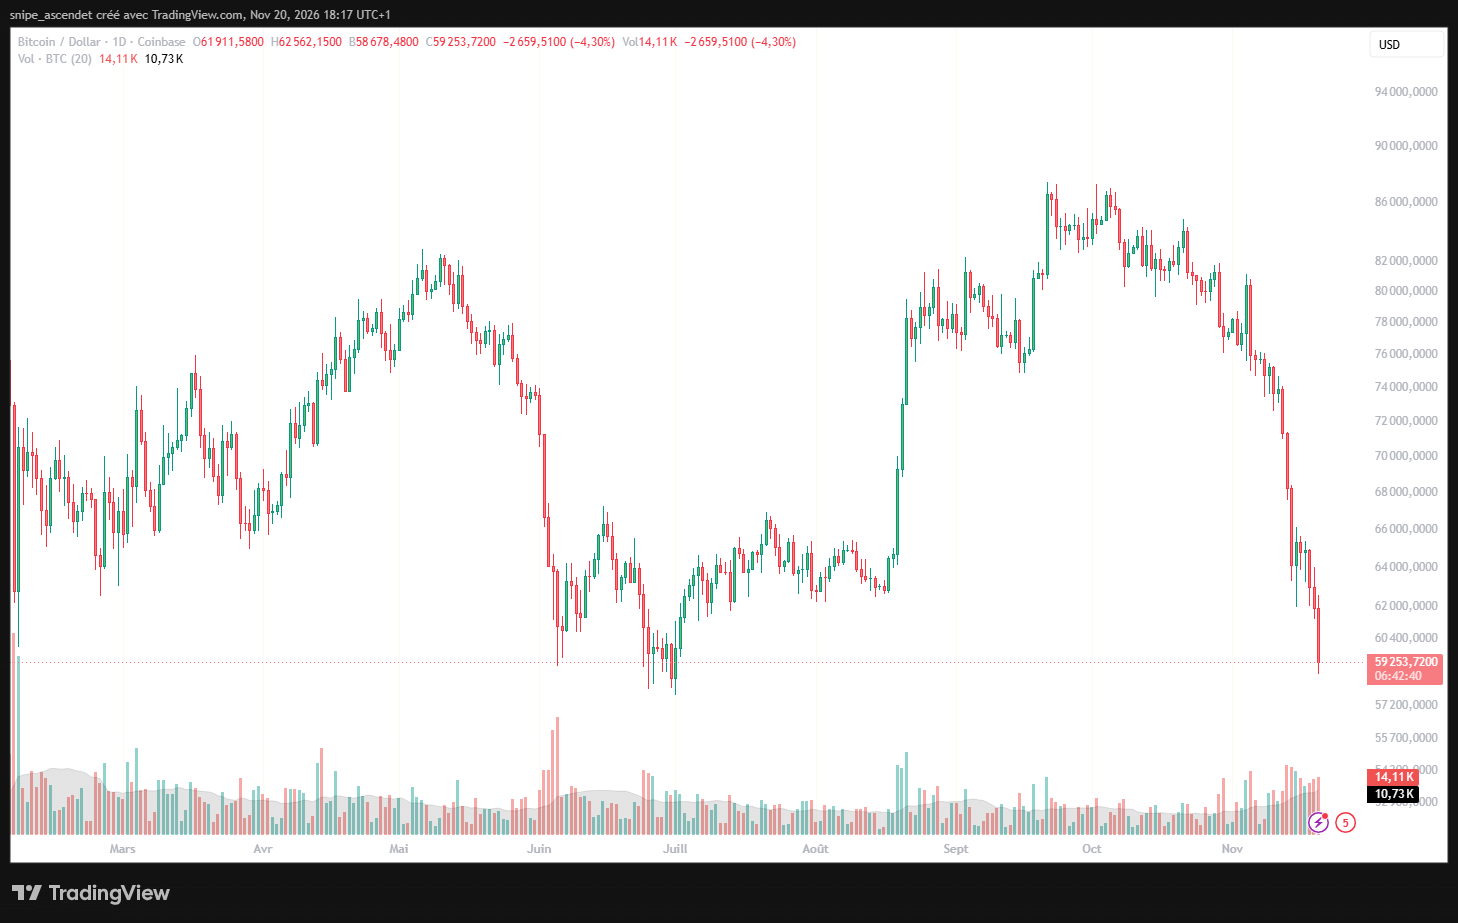
Trading activity also increased: the day’s displayed Bitcoin volume was 14.11K BTC against a 20-session average of 10.73K BTC at the reading, about 31.5% higher. Because Friday’s candle was still forming, that comparison does not represent final daily volume. It nevertheless shows that the move was occurring with meaningful turnover rather than on a thin, isolated print.
Why Are Ether and Smaller Cryptocurrencies Falling Faster?
Ether dropped to 1,631.45 USDT on Binance, down 7.16% for Friday at 12:17 p.m. ET. Its session low of 1,624.37 USDT approached the late-June lows visible on the daily chart. Ether’s larger decline relative to Bitcoin reflects the more difficult environment for higher-volatility digital assets as investors reassess exposure to risk.
The weakness extends beyond the two largest coins. Zcash traded at 750.96 USDT, down 16.03%, while Hyperliquid’s HYPE token stood at 61.121 USDT, down 8.55%, in approximately the same 12:17 p.m. ET readings. Zcash’s particularly sharp move followed its earlier rally and should not be interpreted as proof of a new token-specific development without separate evidence.
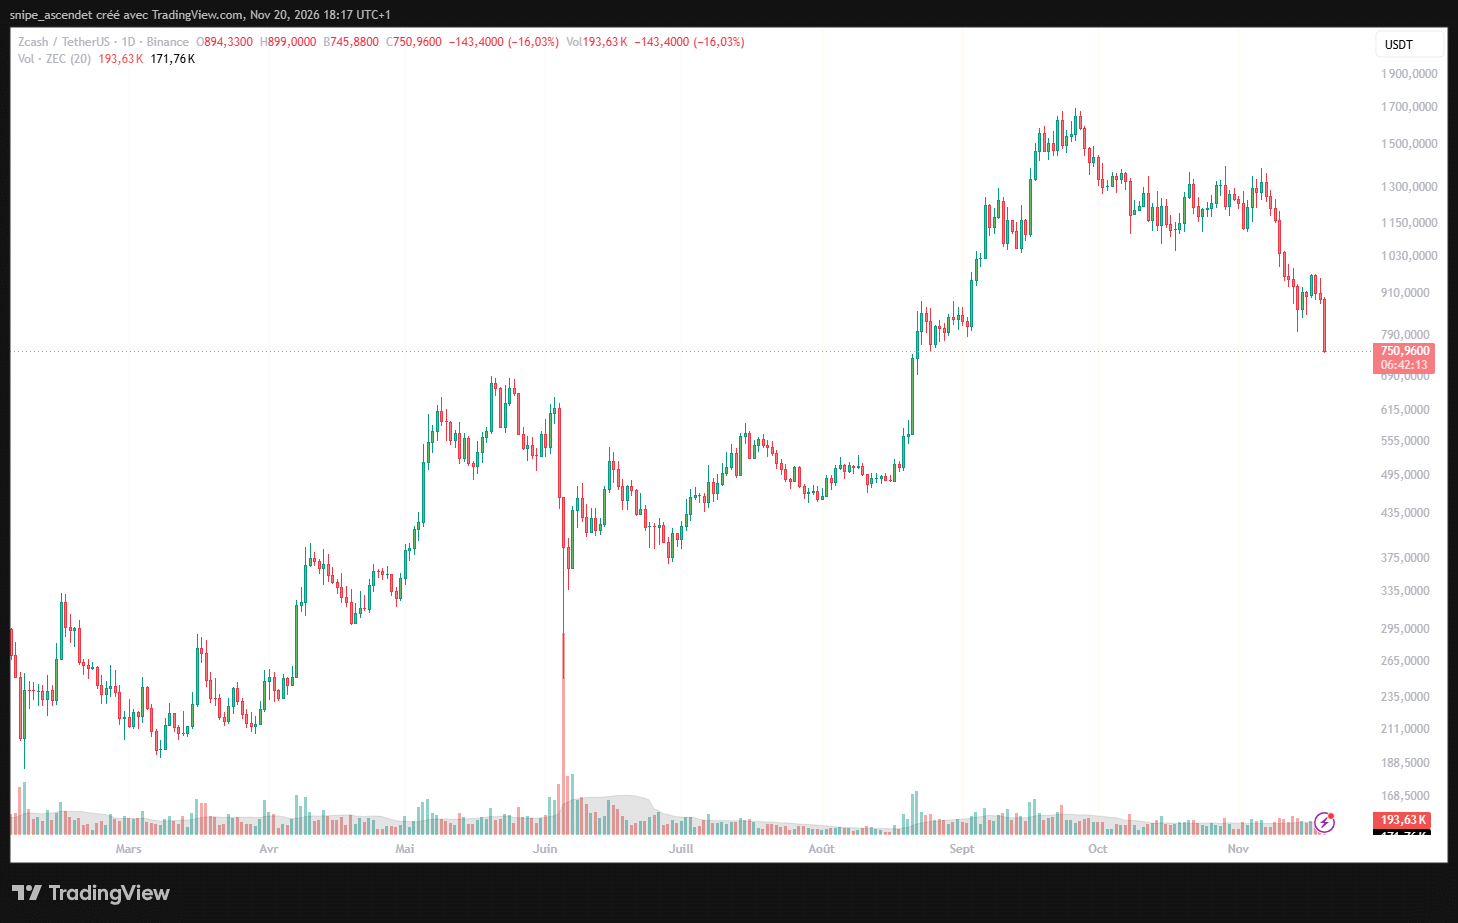
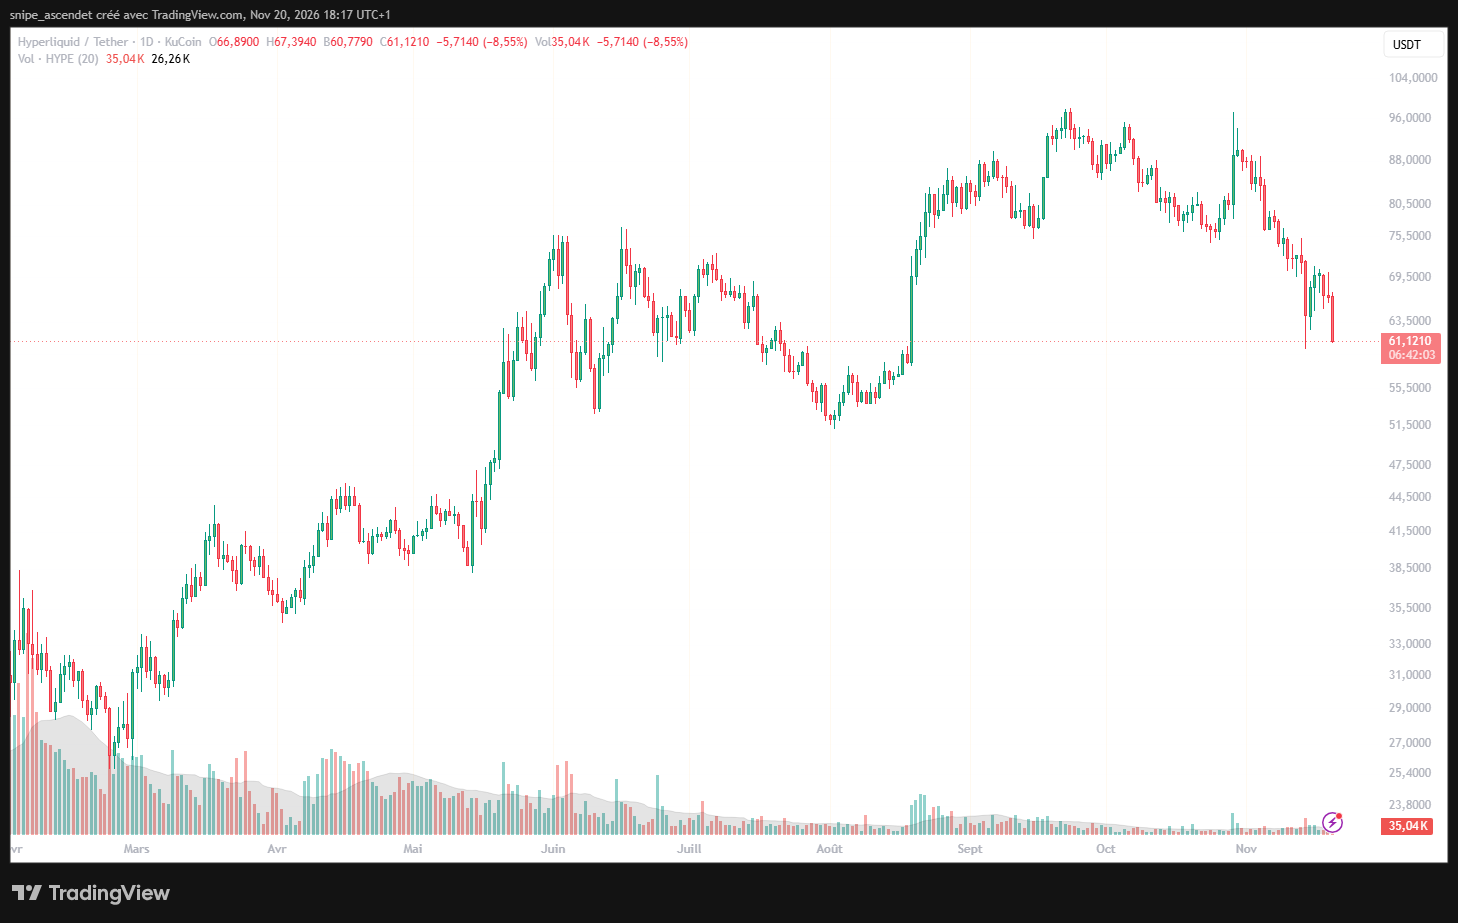
For shareholders in crypto-linked companies and holders of spot crypto exchange-traded products, this broadening matters. A Bitcoin-only selloff could be explained by coin-specific supply or demand. Concurrent double-digit declines in some altcoins point to stress across riskier parts of the digital-asset market, where volatility can be amplified by leverage and thinner liquidity.
Why Is Gold Falling When Investors Are Seeking Safety?
Gold was quoted at $3,532.76 per ounce on the daily series at 12:18 p.m. ET, down 2.55% on Friday. Its intraday low was $3,514.65. The separate weekly series showed $3,533.66 and a 9.02% weekly decline, consistent with Reuters’ report that bullion was heading for its worst week in eight months and had reached its lowest levels since September 2025.
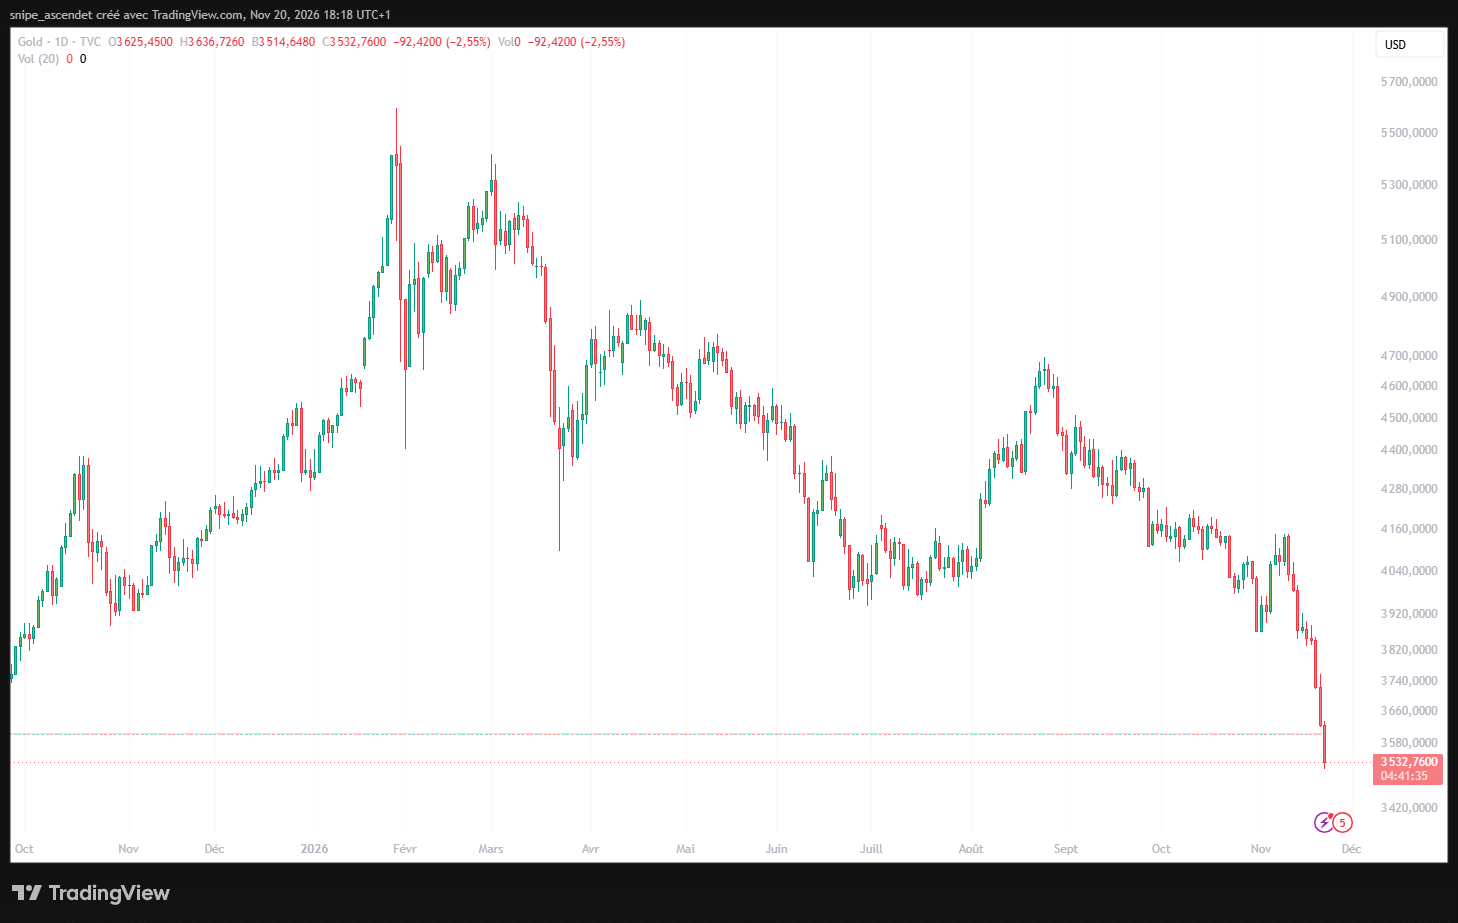
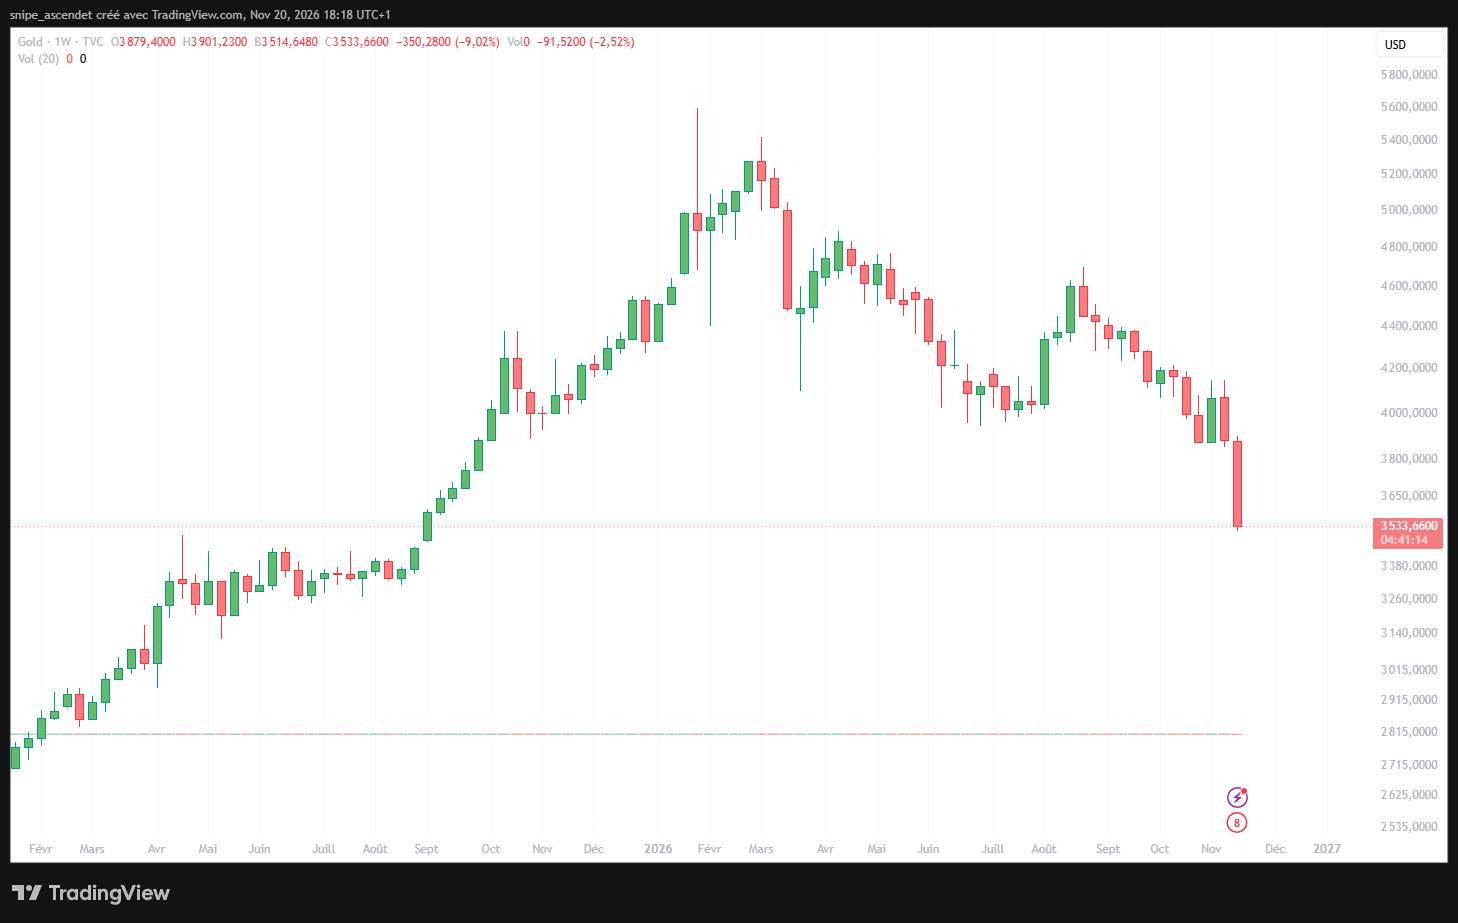
Gold is a long-run store of value, not a guaranteed hedge against every short-term equity selloff. It pays no interest, so higher expected real yields can increase the opportunity cost of holding it; a stronger dollar can also weigh on dollar-denominated metal prices. CoinDesk highlighted real-rate pressure, while Reuters cited a firmer dollar and the prospect of further Federal Reserve tightening.
There is a second, less intuitive force. When investors need cash to meet redemptions or reduce leverage, they may sell liquid winners as well as losing assets. Reuters quoted a metals trader describing AI-related equity losses as a source of forced gold liquidation. That helps explain how gold and stocks can fall together during a risk-off episode.
What Does Silver’s Fall to $41.12 Signal?
Spot silver on the FXCM series fell to $41.117 per ounce at 12:19 p.m. ET, a 3.77% decline on Friday, after touching $40.946. It was also 4.07% below the comparable November 19 reference reading of $42.863. The recent daily sequence shows successive lower highs and lower lows, with the decline accelerating toward the $40 level.
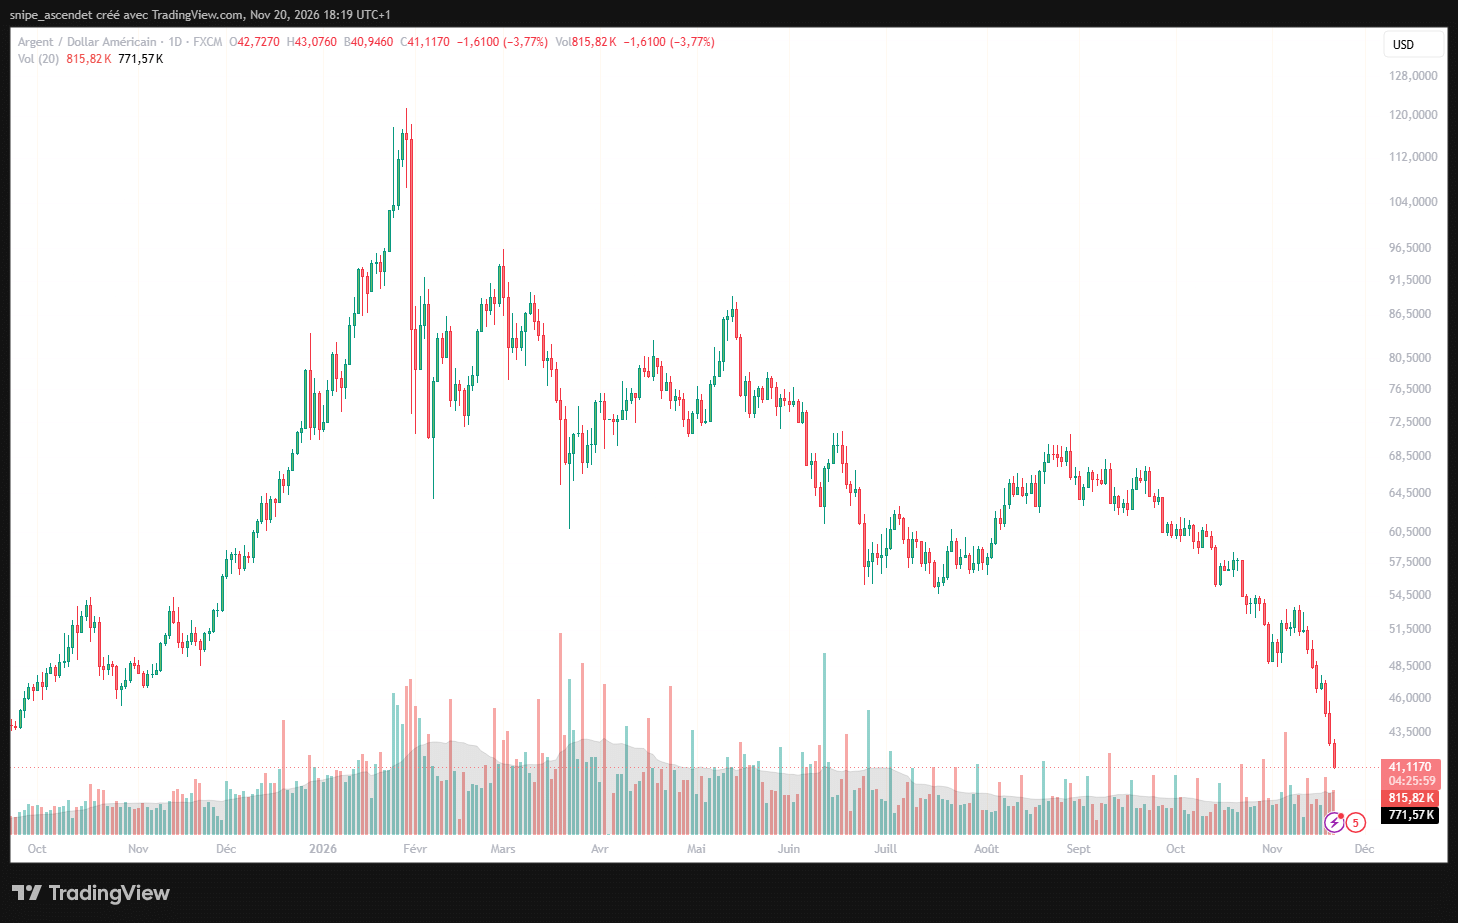
Silver combines the monetary characteristics of a precious metal with industrial demand from manufacturing, electronics and energy technologies. That makes it especially vulnerable when higher interest rates pressure investment demand while investors also question the outlook for growth. The immediate price markers are the $40-$41 area below and approximately $43-$45 above; neither level should be treated as a firm valuation anchor.
How Are the Fed and the AI Stock Selloff Connected?
The Federal Reserve minutes published November 18 show that almost all participants at the October 27-28 meeting expected additional interest-rate increases to be appropriate under their baseline outlook. The committee had kept its policy range at 3.75%-4.00%; two voting members preferred an immediate quarter-point increase. Reuters reported that traders priced roughly a 99% probability of a 25-basis-point December hike during Friday’s session, an expectation rather than a Fed commitment.
Those expectations raise the discount rate applied to long-duration growth assets and the hurdle for non-yielding investments. They also affect leveraged trades, since financing costs rise or remain restrictive. Even if nominal Treasury yields retreat temporarily as investors buy government bonds for safety, the stronger-dollar and restrictive-policy backdrop can still pressure gold and crypto.
The stock-market connection is equally important. On Thursday, November 19, the S&P 500 closed at 7,175.83, down 2.02% and about 2.34% below its 200-day moving average of 7,348.02. Its the S&P 500 break below its 200-day average reflected broad weakness rather than a narrowly concentrated crypto selloff.
Meanwhile, Anthropic’s first-day trading reversal captured the fragility of AI sentiment: the newly public stock closed its first session at $96.86, 16.70% above its $83 IPO price but 13.13% below its $111.50 opening trade. That reversal coincided with a wider retreat from AI-exposed equities. It is best understood as part of the risk backdrop, not as the sole cause of the losses in bullion and digital assets.
What Should Investors Watch After the Selloff?
The next market test is whether Bitcoin can recover and hold $60,000 rather than merely touch it during a short bounce. Ether needs to stabilize above its Friday $1,624.37 session low; gold faces a near-term test of the $3,500 area, and silver is approaching $40. Continued selling in altcoins while Bitcoin pauses would suggest risk appetite remains weak.
Investors should also watch the US stock market through the regular-session close on Friday, November 20, 2026, at 4:00 p.m. ET, and then the next trading session on Monday, November 23. The next scheduled FOMC meeting is December 8-9, 2026, when the decision and updated economic projections will test whether markets have priced the policy outlook accurately.
Bottom line: Bitcoin below $60,000 is now part of a synchronized drawdown in crypto, gold, silver and growth-sensitive equities. Friday’s readings show particularly severe pressure in Ether, Zcash and silver, while gold’s roughly 9% weekly loss demonstrates that traditional havens can be sold for liquidity during a broad deleveraging episode. A durable recovery requires both price stabilization and a less hostile interest-rate and dollar backdrop.
For informational purposes only; not investment advice.