


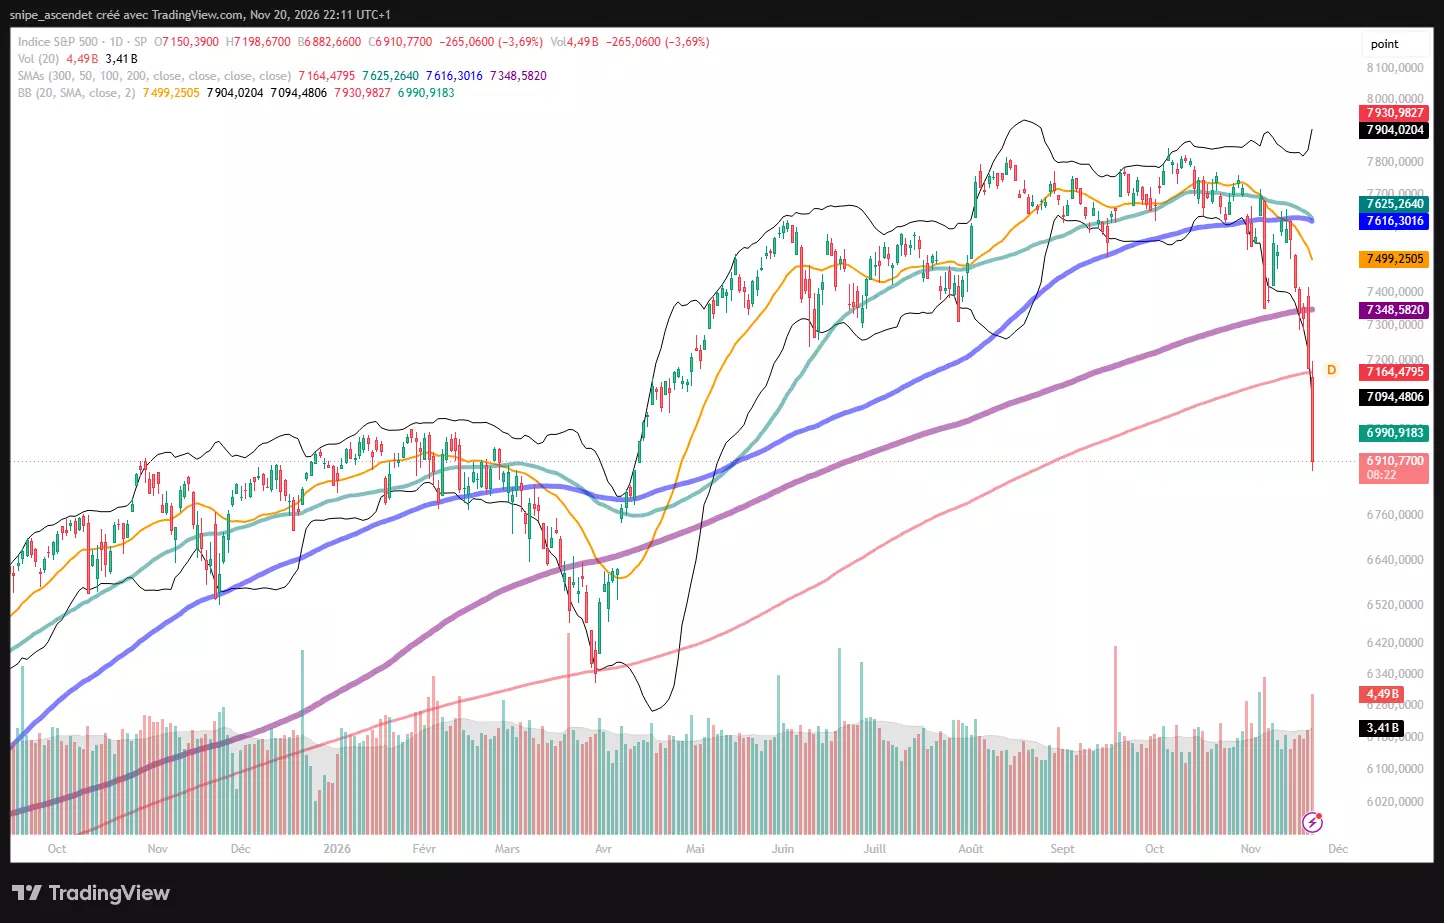
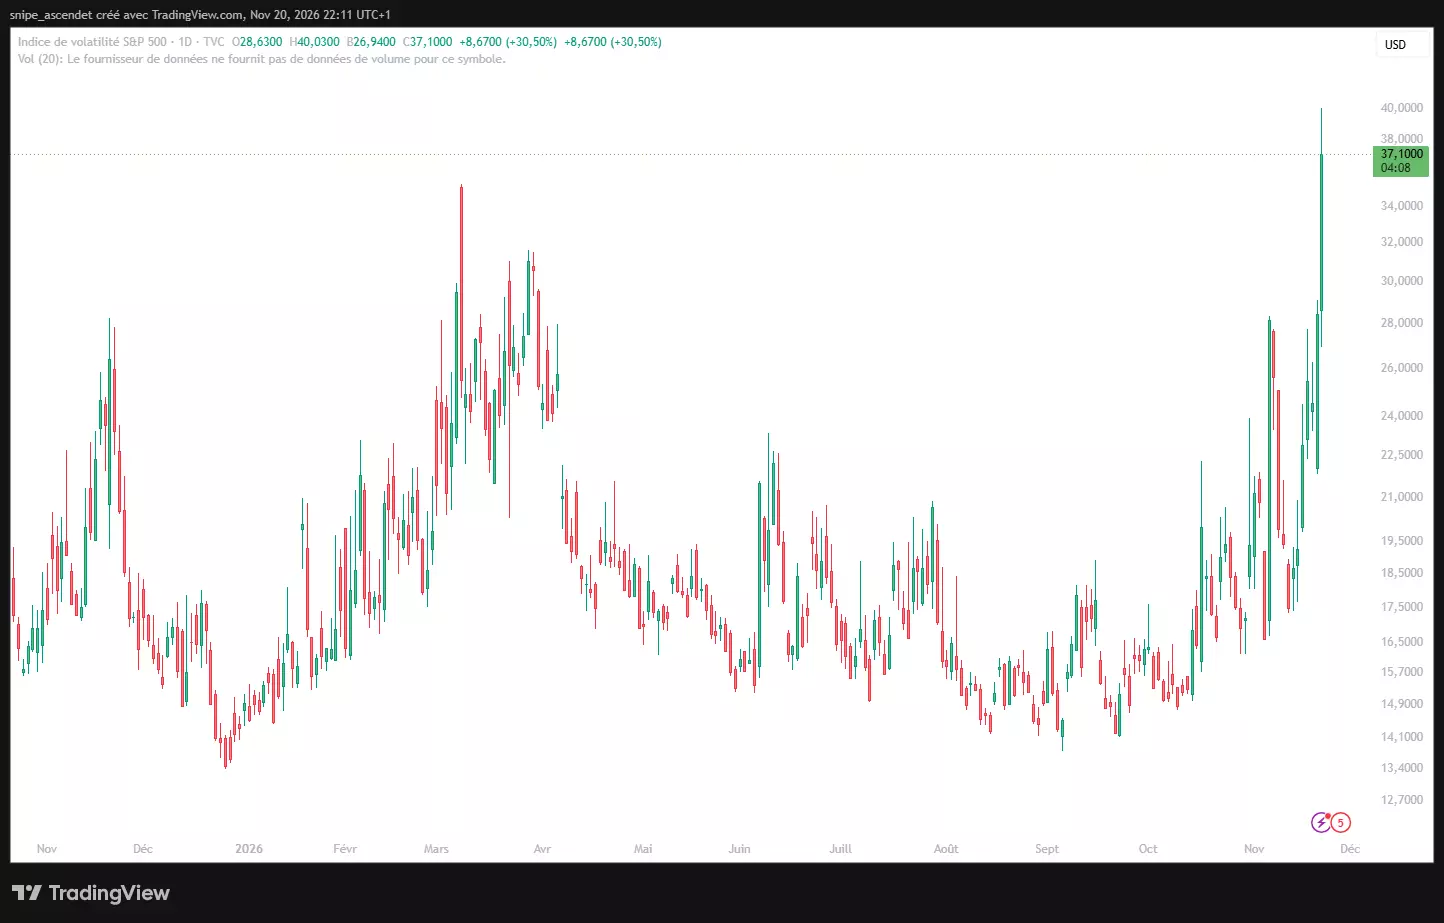
Update, Nov. 20, 4:12 p.m. ET: The S&P 500 selloff intensified on Friday, November 20, 2026, as the benchmark fell 3.69% to 6,910.77, closing below 7,000 and its 200-day and 300-day moving averages. The Cboe Volatility Index (VIX) reached 40.03 intraday with a 37.10 reading around 4:11 p.m. ET, while Nvidia, Broadcom and Micron each lost more than 12%.
The selloff links several developments that now matter to shareholders at the same time: mounting scrutiny of Nvidia, potential changes in Google’s AI chip orders, a weaker NAND pricing outlook, and falling cryptocurrencies and precious metals. Higher volatility and heavy trading volume raise the risk that company-specific setbacks will continue to spill into the broader market.
How Far Did the S&P 500 Selloff Extend on November 20?
The S&P 500 dropped 265.06 points from its November 19 close of 7,175.83. The decline followed a global retreat in technology exposure: Reuters reported November 20 declines of more than 5% in Japanese and South Korean benchmarks. November 20 was the benchmark’s seventh consecutive declining session, taking it roughly 11.62% below its October 6 record close of 7,818.93. That qualifies as a correction, conventionally defined as a decline of at least 10% from a recent peak.
| Asset | Nov. 20 latest | Daily change | Notable session detail |
|---|---|---|---|
| S&P 500 | 6,910.77 | -3.69% | Low 6,882.66; 4.49B reported index-volume units |
| Cboe VIX | 37.10 | +30.50% | High 40.03 |
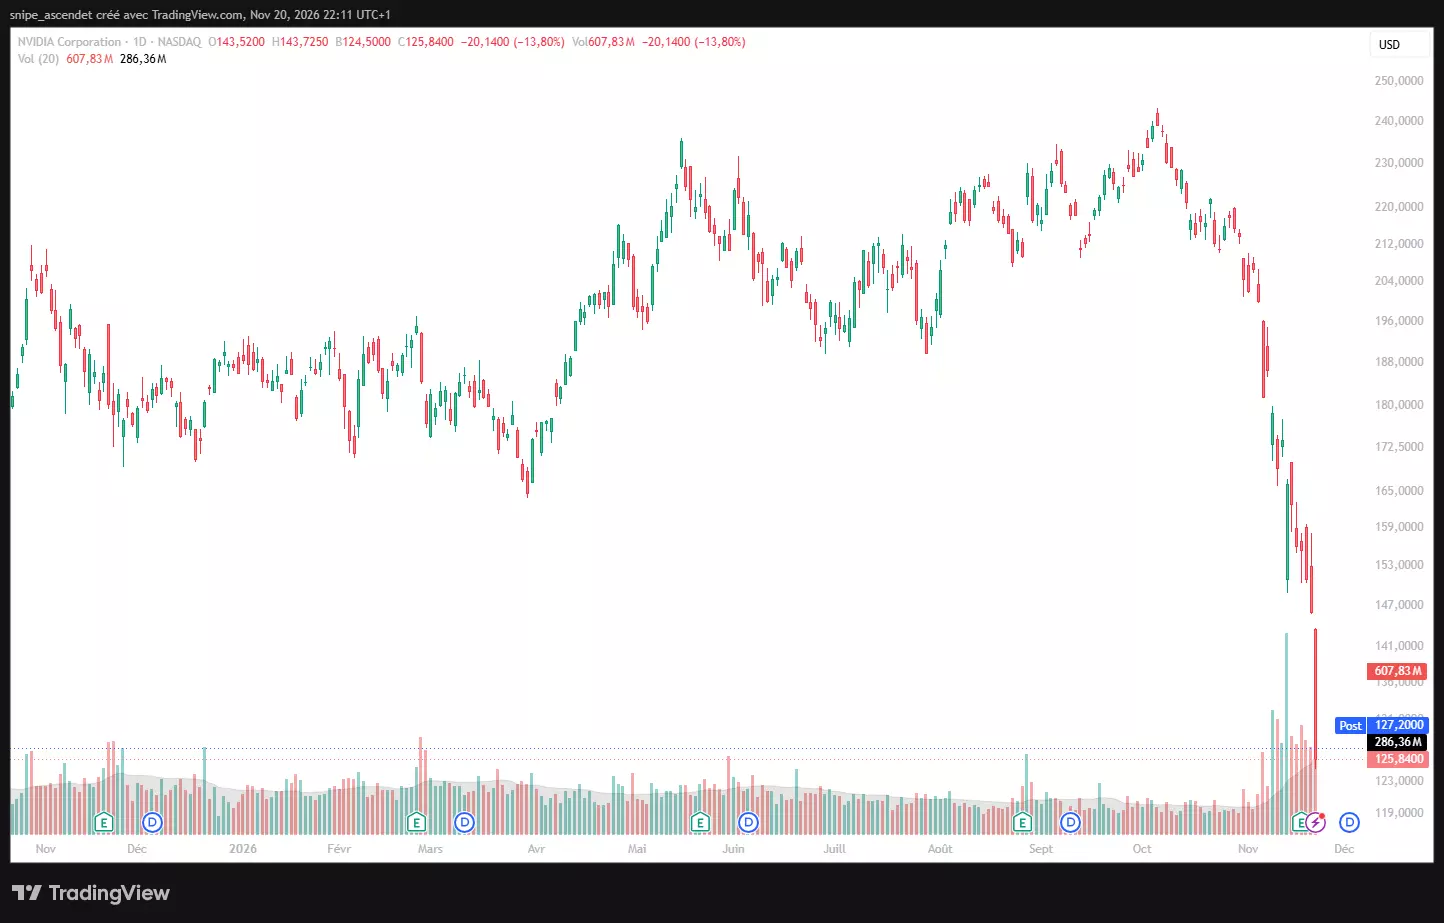
| Nvidia (NVDA) | $125.84 | -13.80% | 607.83M shares; 2.12 times 20-day average |
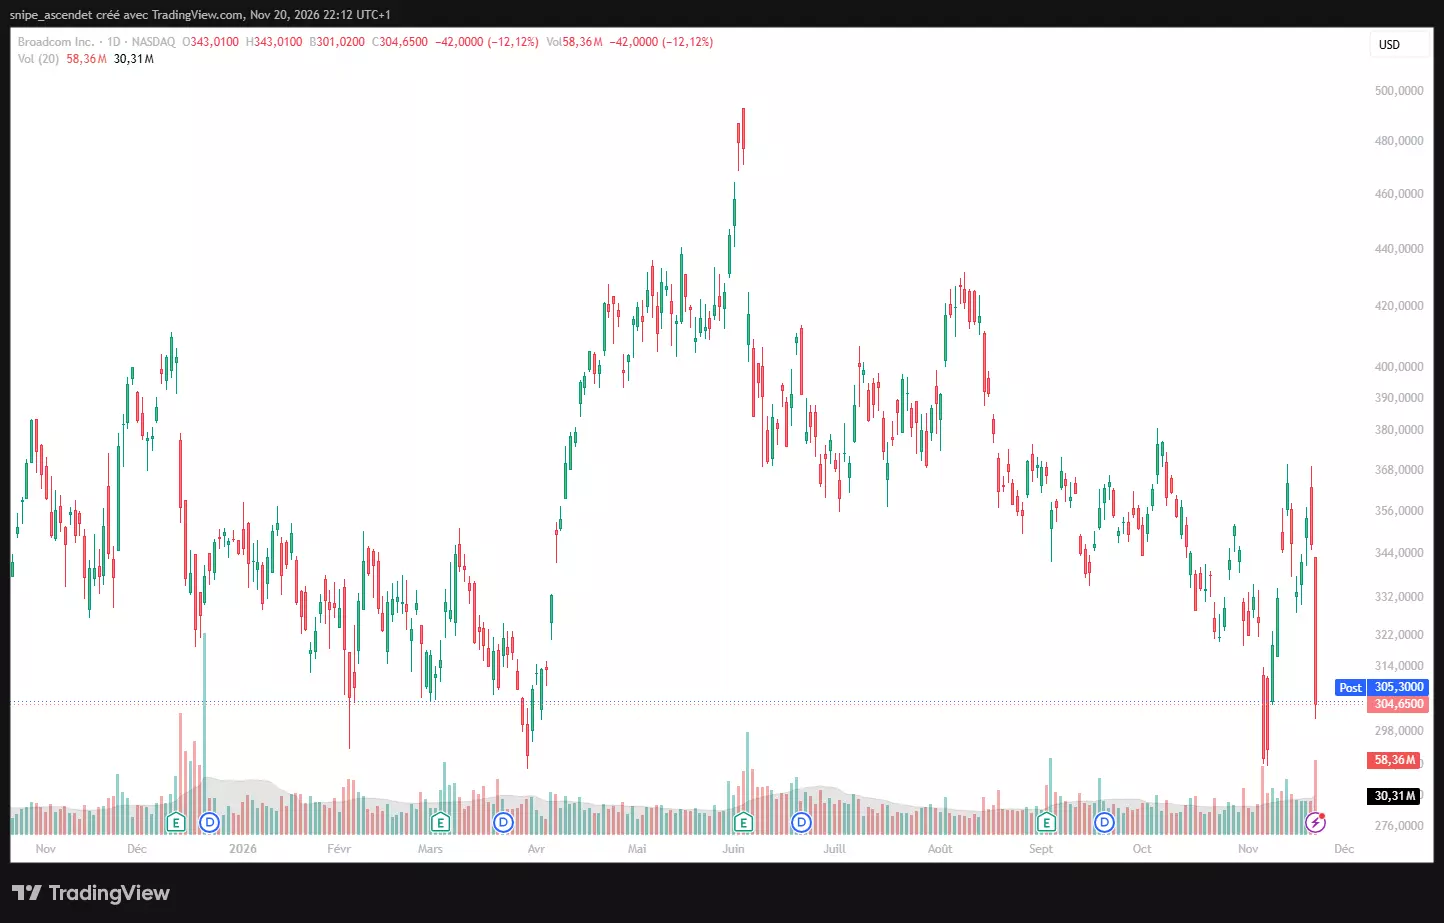
| Broadcom (AVGO) | $304.65 | -12.12% | 58.36M shares; 1.93 times 20-day average |
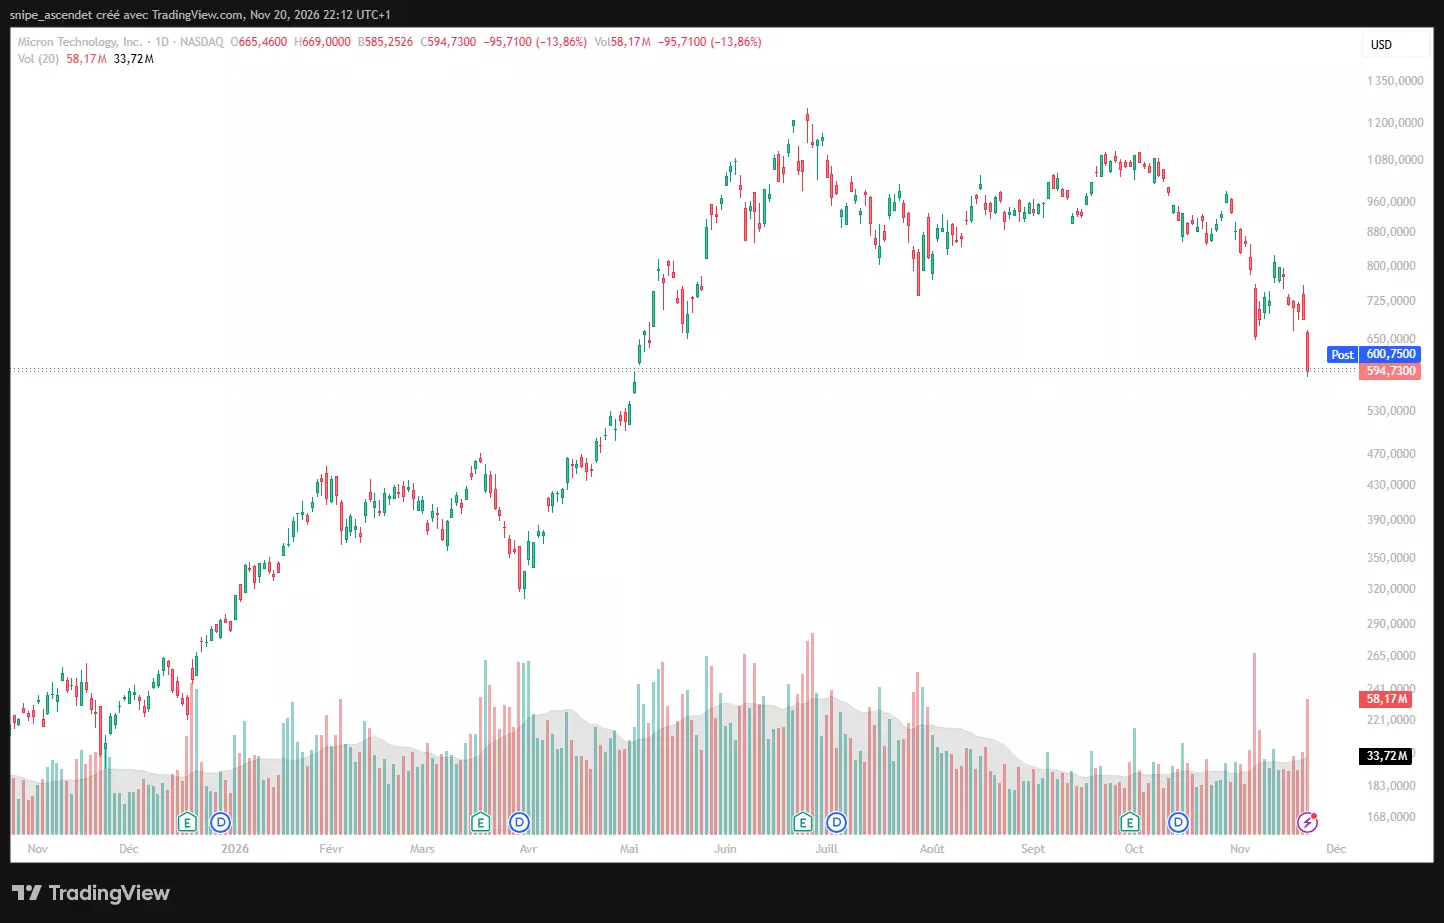
| Micron (MU) | $594.73 | -13.86% | 58.17M shares; 1.73 times 20-day average |
The prices and volumes above are the latest regular-session readings around 4:11–4:12 p.m. ET on November 20. The S&P 500’s reported daily volume of 4.49 billion was 31.7% above its 20-session average of 3.41 billion, consistent with a heavily traded decline rather than an isolated late-day dip.
Why Does the Break Below the 200-Day and 300-Day Averages Matter?
The S&P 500 had already moved beneath its 200-day average before Thursday’s selloff. Friday brought another deterioration: at 6,910.77, the index stood 5.96% below its 200-day line at 7,348.58 and 3.54% below its 300-day line at 7,164.48. Those are materially different conditions from a market merely testing one long-term trend indicator.
The 7,000 mark is now an overhead psychological reference rather than support. The November 20 session low of 6,882.66 is the immediate downside level to watch; a recovery toward 7,164 and then 7,349 would need to persist before the medium-term picture improves. Moving averages do not set guaranteed floors, but repeated failures to reclaim them can indicate that rallies are being used to sell positions.
What Does a VIX Spike to 40 Mean for Investors?
The VIX increased by 8.67 points, or 30.50%, from the November 19 reference of 28.43 to a reading of 37.10 around 4:11 p.m. ET on November 20. Its session peak of 40.03 is the important distinction: the fear gauge touched 40 but its 4:11 p.m. ET reading was below 40.
The index reflects option-implied expectations for S&P 500 volatility over roughly the next 30 days, not a forecast that stocks must fall another 37%. Such a jump generally indicates demand for downside protection and can raise hedging costs. A durable pullback in volatility alongside improving market breadth would be more encouraging than an index rebound occurring while protection remains unusually expensive.
Why Did Nvidia Fall 13.80% Despite Strong Earnings?
Nvidia (NASDAQ: NVDA) closed at $125.84 on November 20, down $20.14, or 13.80%, from the prior session. Trading reached 607.83 million shares against a 20-session average of 286.36 million, more than twice normal turnover. The declines accelerated after Reuters reported that SEC enforcement staff were examining potential accounting issues at the chipmaker, citing two people familiar with the inquiry. The agency’s precise concerns remain undisclosed, and an investigation is not a finding of wrongdoing.
The market response contrasts with Nvidia’s fiscal third-quarter 2027 results: revenue rose 103% year over year to $115.8 billion, and GAAP operating cash flow reached $48.25 billion, equal to approximately 41.7% of sales. The central investor question is therefore not simply whether demand for chips exists. It is whether future cash collection, reporting transparency and the financing of AI customers can justify the valuation assigned to that growth.
The full Nvidia SEC investigation and cash-flow analysis examines revenue reporting, receivables and governance in more detail. For diversified portfolios, Nvidia’s large index weight makes its company-specific repricing a broader market issue, especially when other semiconductor names are falling simultaneously.
How Do Broadcom’s Google TPU Report and Micron’s NAND Outlook Fit Together?
Broadcom (NASDAQ: AVGO) dropped 12.12% to $304.65. Supply-chain analyst Ming-Chi Kuo said Google had reportedly reduced planned 2027 shipments of Broadcom-designed TPU 8i processors by roughly one million units, or around 20% of the anticipated volume for that series, while considering more MediaTek-designed TPU 8t chips. The claimed allocation change has not been independently confirmed by Google; it is a forecast risk rather than a confirmed cancellation of Broadcom revenue.
Investors are now weighing whether the AI infrastructure market is still growing fast enough to support the highest supplier revenue expectations, and which providers win the mix of custom-chip designs. Our analysis of Broadcom’s reported Google TPU order cuts addresses customer concentration, the potential product-mix shift and what it could mean for margins.
Micron Technology (NASDAQ: MU) fell 13.86% to $594.73, while Sandisk (NASDAQ: SNDK) also faced selling pressure. The direct fundamental development is a TrendForce projection that NAND flash contract prices may decline 0%–5% quarter over quarter in the first quarter of 2027, followed by a broader downward pricing cycle from the second quarter. TrendForce expects 2027 NAND bit supply to grow 25%–30%, with reduced orders from Chinese cloud service providers more than offsetting additional U.S. cloud demand.
The pressure differs by business model. NAND pricing directly affects Sandisk’s storage economics, while Micron has exposure to DRAM and high-bandwidth memory as well. Weak NAND forecasts therefore do not imply an identical revenue or margin impact across all memory producers. The Sandisk, Micron and 2027 NAND pricing breakdown explains those differences and the implications for the wider chip supply chain.
Why Are Bitcoin, Gold and Silver Falling Alongside US Stocks?
Cross-asset weakness adds another layer of pressure. Bitcoin fell below $60,000 on November 20, according to Reuters. Earlier in the session, Bitcoin traded at $59,253.72 and Ether at 1,631.45 USDT around 12:17 p.m. ET, while gold was near $3,532.76 an ounce and silver near $41.117 an ounce in the same period. These are dated intraday comparisons, not closing quotes.
Gold’s weakness during an equity selloff is not necessarily contradictory. Rising rate expectations can weigh on non-yielding assets; a previously stronger dollar added another headwind; and investors reducing leverage may sell liquid positions across asset classes. Reuters also reported that U.S. Treasury yields fell as government bonds rallied during Friday’s flight to safety, showing why intraday bond moves and the broader higher-rate backdrop must be distinguished.
Our November 20 analysis of Bitcoin, Ether, gold and silver places the moves in context. For equity shareholders, synchronized pressure across stocks, cryptocurrencies and metals means portfolio diversification may deliver less short-term protection when the common driver is a rapid reduction in risk.
What Role Did Anthropic’s IPO, the Fed and AI Financing Play?
Anthropic (NASDAQ: ANT) made its public-market debut on November 19 at $111.50 after pricing at $83. Its first-session close of $96.86 still represented a 16.70% premium to the IPO price, but a 13.13% decline from its opening trade. The reversal showed that a record-breaking capital raise could coexist with a weakening market for AI-related shares rather than counteracting it.
Funding costs compound that problem. The Federal Reserve’s October 27–28 meeting minutes noted concerns among policymakers that disappointing returns on AI investment could become a financial-stability risk. Investors also have to separate the interest-rate backdrop from Friday’s safe-haven rally: during the session, Reuters reported the 10-year Treasury yield near 4.948% as bond prices increased, even though expectations for tighter policy remained part of the market debate.
The transmission mechanism is practical. If AI customers lower capital spending, chipmakers lose expected sales; if financing becomes more expensive, data-center projects face a higher return threshold; and if investors mark down future growth, highly valued stocks can fall more than the earnings revisions themselves. None of these channels requires AI investment to stop completely for equity prices to adjust sharply.
- Monday, November 23: Watch whether the S&P 500 holds Friday’s 6,882.66 low, recovers 7,000 and shows broader buying beyond a few large technology names.
- Volatility: Follow whether the VIX retreats from the high-30s toward 30 without another spike in protection demand.
- Technical recovery: The 300-day average near 7,164.48 comes before the 200-day average near 7,348.58 on the path back up; both should be recalculated as trading continues.
- Company disclosures: Monitor Nvidia’s response to the SEC reporting, Google’s TPU sourcing plans and updates to NAND pricing and inventory forecasts.
- Upcoming dates: Nvidia is scheduled to present at the UBS Global Technology and AI Conference on December 1; the Federal Reserve’s next FOMC meeting is December 8–9, 2026.
A constructive scenario would combine stabilizing AI earnings expectations, narrower credit risk, lower volatility and a recovery of the broken averages. A weaker scenario would see additional cuts to AI spending plans or deterioration in financial disclosures, with volatility staying elevated and the S&P 500 failing to reclaim even 7,000. Neither outcome follows automatically from a single trading session.
Bottom line: The November 20 selloff is no longer just a failed attempt by the S&P 500 to hold its 200-day moving average. A 3.69% index drop, a VIX spike to 40.03 and simultaneous double-digit losses in leading chipmakers show that investors are repricing the AI trade and the risks surrounding it across multiple markets. The next decision for shareholders is whether earnings quality, cash generation and funding conditions can stabilize before a technical rebound loses momentum.
For informational purposes only; not investment advice.