


SoftBank Group’s five-year credit default swap (CDS) spread reached 466 basis points on November 6, 2026, its widest level since October 2022. Four days later, the Japanese technology investment conglomerate reported a July–September net loss of roughly ¥1.1 trillion ($7 billion), while quarterly financing costs more than doubled to about ¥462 billion. The juxtaposition turns a sharp selloff in a high-profile AI investor into a more consequential question: how much balance-sheet flexibility can SoftBank retain while financing its $64.6 billion investment in OpenAI? The November 6 credit data and November 10 earnings report are the essential starting points.
The answer is more nuanced than the viral claim that SoftBank has a 33% chance of going bankrupt within five years. A CDS-derived default estimate is a market-implied, model-dependent credit measure, not a statistically established probability of bankruptcy. SoftBank still reports substantial investment assets and a 15.9% adjusted loan-to-value ratio as of September 30, but recent moves in listed holdings mean that historical ratio should not be mistaken for today’s leverage.
SoftBank Stock Rebounds 13.88%, Even as Credit Investors Demand Protection
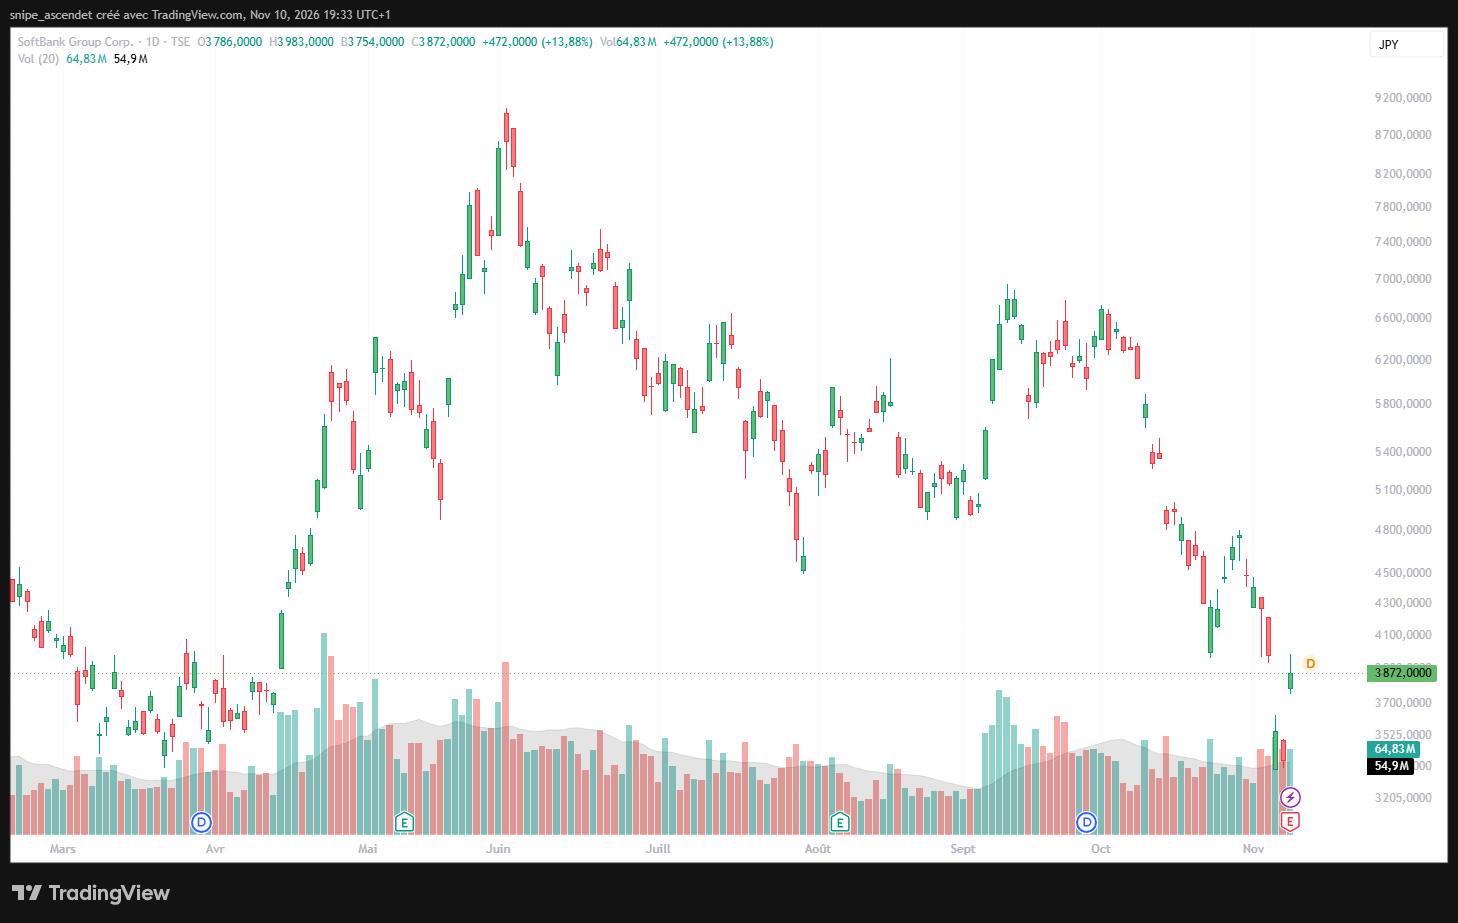
SoftBank shares closed at ¥3,872 on the Tokyo Stock Exchange on November 10, a gain of ¥472 or 13.88%, according to the supplied TradingView daily chart. Trading volume was approximately 64.83 million shares, above the displayed 20-session volume average of 54.9 million. The rally happened before the earnings release, so it cannot be described as a positive market reaction to results announced later that day. Reuters separately described an almost 14% rebound ahead of the report.
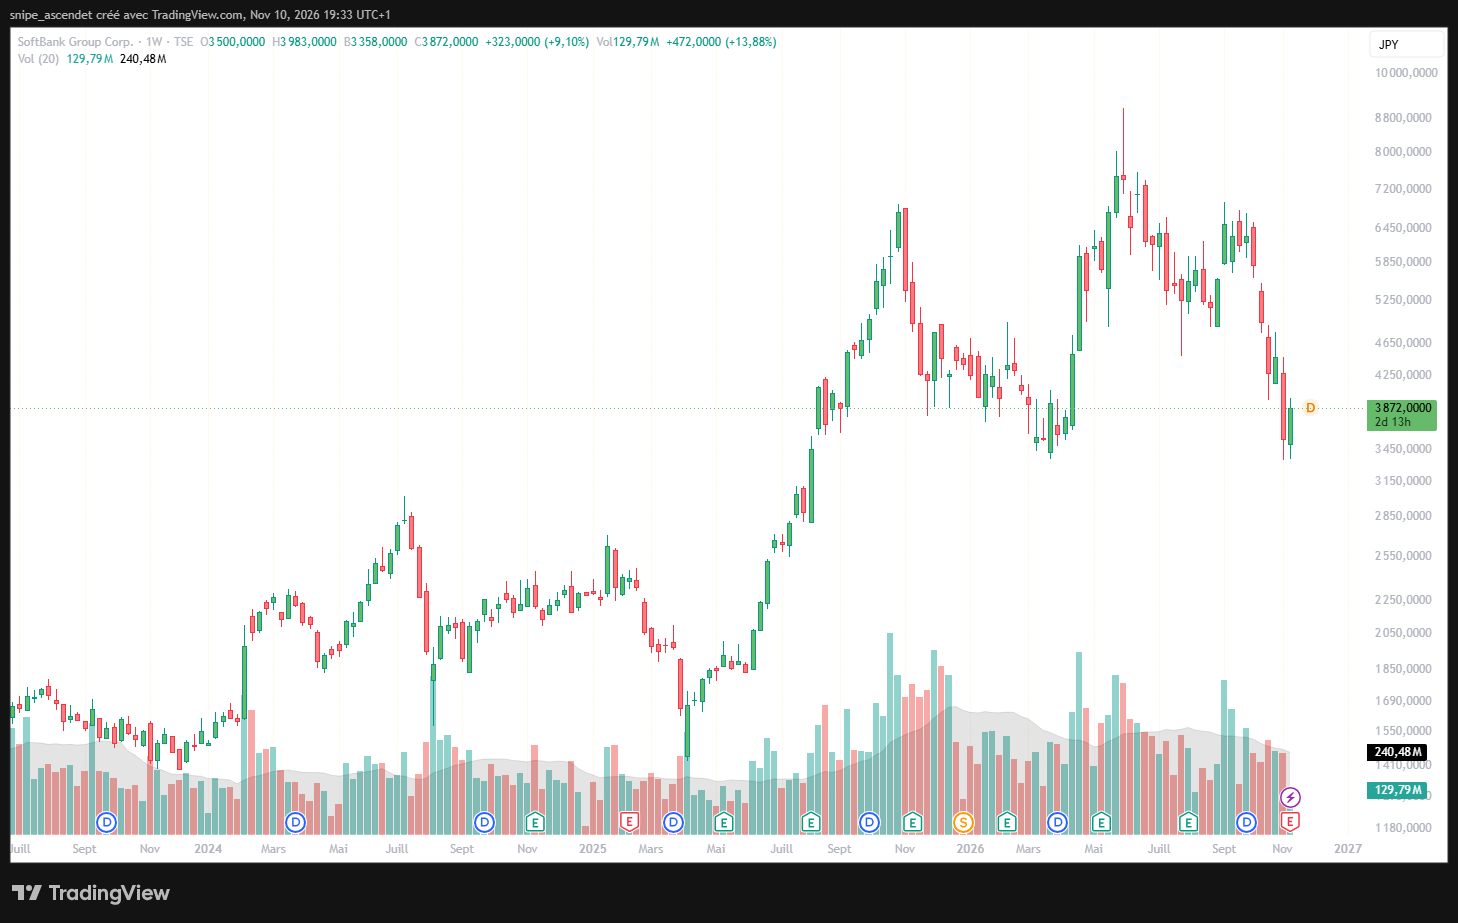
The short-term rebound also needs a longer horizon. The weekly screenshot shows a steep decline from the highs recorded earlier in 2026 to the ¥3,872 level. Because the November 9–13 weekly candle was still forming when the capture was taken, its displayed weekly change is not a completed weekly return. The market has not established that the pressure on SoftBank shares or its borrowing terms has ended.
Does a 493-Basis-Point CDS Mean a 33% Bankruptcy Probability?
Reuters reported that SoftBank’s five-year CDS touched 466 basis points on November 6 and stood at 457.5 basis points at 06:53 GMT according to Markit. That report cited an associated 30.6% default probability. An additional circulating chart supplied for this analysis displays 493.43 basis points, but its latest pricing date, contributor and contract terms cannot be independently authenticated. Consequently, 493.43 basis points is used only to explain the mathematics, not presented as a verified November 10 closing spread.
In a simplified flat-hazard model, one can approximate the annual default intensity as the CDS spread divided by one minus the assumed recovery rate. At 493.43 basis points, the annual spread is 4.9343%. Assuming 40% recovery, the implied hazard rate is about 8.22% per year. The formula 1 − exp(−0.08224 × 5) produces an illustrative five-year risk-neutral cumulative default probability of approximately 33.7%. A different recovery assumption, discount curve, CDS quotation convention or market premium can change that estimate.
| Credit observation | Level | What it supports |
|---|---|---|
| November 6, Reuters / Markit | Up to 466 bps; 457.5 bps at 06:53 GMT | A verified four-year-high credit spread; Markit-reported model estimate of 30.6% |
| User-supplied CDS chart | 493.43 bps; quote date not verified | An illustrative calculation, not a dated official close |
| Illustrative model at 493.43 bps | ~33.7% over five years with 40% assumed recovery | Risk-neutral pricing estimate, not a measured bankruptcy frequency |
CDS contracts compensate investors when specified credit events occur under their terms. Those events are not identical to an ordinary-language corporate bankruptcy, and CDS quotes also reflect liquidity and risk premiums. In addition, quoted spreads do not necessarily equal an investor’s cash premium on a standardized contract. Investors who want basic background on corporate debt instruments can consult the French-language explanation of bonds and issuer default risk; for market-specific credit stress, Bourse24’s French-language analysis of neocloud CDS spreads illustrates why sector-wide financing pressure deserves attention.
The November 10 Earnings Shock: A $7 Billion Quarterly Loss
SoftBank’s July–September quarter delivered a net loss of approximately ¥1.12 trillion, compared with a ¥2.50 trillion profit a year earlier. Bloomberg’s reported consensus of eight analysts expected roughly ¥129 billion in profit. The gap is about ¥1.25 trillion, although earnings at an investment holding company can be heavily affected by asset valuations and unusual accounting items. The figures below are reported yen amounts, not stock-price changes.
| Metric | Reported | Expected | Difference |
|---|---|---|---|
| Quarterly net income attributable to owners | About −¥1.12 trillion | About +¥129 billion (Bloomberg analyst average) | Roughly −¥1.25 trillion |
| Quarterly financing costs | About ¥462 billion | No matching reliable consensus verified | Not calculated |
The largest reported exceptional charge was approximately $3.7 billion tied to advance payments for power-generation equipment intended for U.S. AI data-center developments, after procurement plans changed. Management said up to $2.1 billion of future purchase rebates could offset part of the impact; those rebates should not be treated as cash already recovered. Read SoftBank’s November 10 earnings materials and the Reuters account of the project charge and funding costs for the disclosed chronology. The implication is operational as well as financial: even a heavily funded AI project can incur material losses when equipment plans change before revenue begins.
Financing costs were another warning sign. Reuters reported that SoftBank raised approximately $56.5 billion of financing in the quarter, including an $11.87 billion term loan, a $10 billion U.S.-dollar bond issue and ¥1 trillion in yen-denominated bonds. The reported borrowing also included an increase of about $5 billion in a margin loan backed by Arm shares, taking that facility to roughly $25 billion. These financing transactions are not themselves evidence of an inability to pay creditors, but they increase the importance of access to capital at acceptable prices.
OpenAI Is a $64.6 Billion Asset Bet, Not Readily Available Cash
On October 1, SoftBank said it had completed a further $10 billion tranche of OpenAI investment, bringing its cumulative commitment deployed to $64.6 billion and ownership to approximately 13%. The company said the final tranche was funded with foreign-currency senior-note proceeds, rather than the canceled remainder of its previous bridge facility. Those specifics matter because funding structure, not simply the size of the stake, determines the strain on SoftBank’s balance sheet. The transaction is documented in the official October 1 SoftBank release.
OpenAI is a privately held investment, so a valuation headline cannot be converted into immediate cash available to repay debt. Monetization through a public listing, private sale or financing transaction depends on timing, market conditions and permissions. Reuters reported that expectations for an OpenAI public offering had shifted toward 2027; that is a reported plan, not an approved offering timetable. The bullish thesis is that valuable equity interests eventually outweigh financing costs. The bearish case is that delayed monetization forces SoftBank to hold expensive debt while its collateral and other holdings fluctuate.
The distinction between operating cash generation and investment spending is especially relevant here. As the FinanceToTheTop guide to calculating free cash flow explains, capital-intensive expansion can leave a company dependent on financing even when underlying demand is growing. SoftBank is a holding company rather than an AI cloud operator, so its consolidated cash flows require a different analytical treatment from those of individual data-center businesses.
SoftBank Reports 15.9% LTV, but Its Asset Cushion Is Price-Sensitive
SoftBank’s September 30 net asset value disclosure shows ¥71.14 trillion of adjusted holdings value, ¥11.30 trillion of adjusted net debt, and ¥59.84 trillion of NAV. Dividing adjusted net debt by adjusted holdings value gives the reported 15.9% loan-to-value ratio. This is SoftBank’s holding-company methodology after specified asset-backed financing adjustments; it is not the same figure as the ¥25.04 trillion of consolidated net interest-bearing debt also shown in its reconciliation.
Arm is a central exposure. SoftBank’s September 30 NAV table attributed ¥42.06 trillion of gross value to Arm shares, or ¥38.16 trillion after an asset-backed financing adjustment. That adjusted Arm figure represented about 54% of total adjusted holdings value at that snapshot. The group has substantial equity assets, but concentration and collateral financing can make market declines relevant to borrowing flexibility. For a French-language primer on the underlying balance-sheet concepts, see FinanceToTheTop.fr’s finance and leverage definitions.
A simple stress test illustrates the mechanics, without claiming that the same asset move would actually occur or that debt remains fixed. Keep adjusted net debt at ¥11.30 trillion and assume adjusted holdings value falls uniformly from the reported ¥71.14 trillion base. The implied ratio rises as asset values fall:
| Illustrative holdings-value change | Hypothetical holdings value | Calculated LTV |
|---|---|---|
| 0% (reported September 30 base) | ¥71.14 trillion | 15.9% |
| −20% | ¥56.91 trillion | 19.9% |
| −40% | ¥42.68 trillion | 26.5% |
This is a mechanical sensitivity calculation, not a forecast or a November 10 LTV estimate. Real financing covenants, foreign exchange, portfolio transactions, private valuations and asset-backed debt adjustments would alter the result. The important observation is that the official 15.9% ratio is based on September 30 values, while the supplied Tokyo and U.S. equity charts show prices at later dates.
Arm, CoreWeave and QQQ Show Distinct Forms of AI Risk
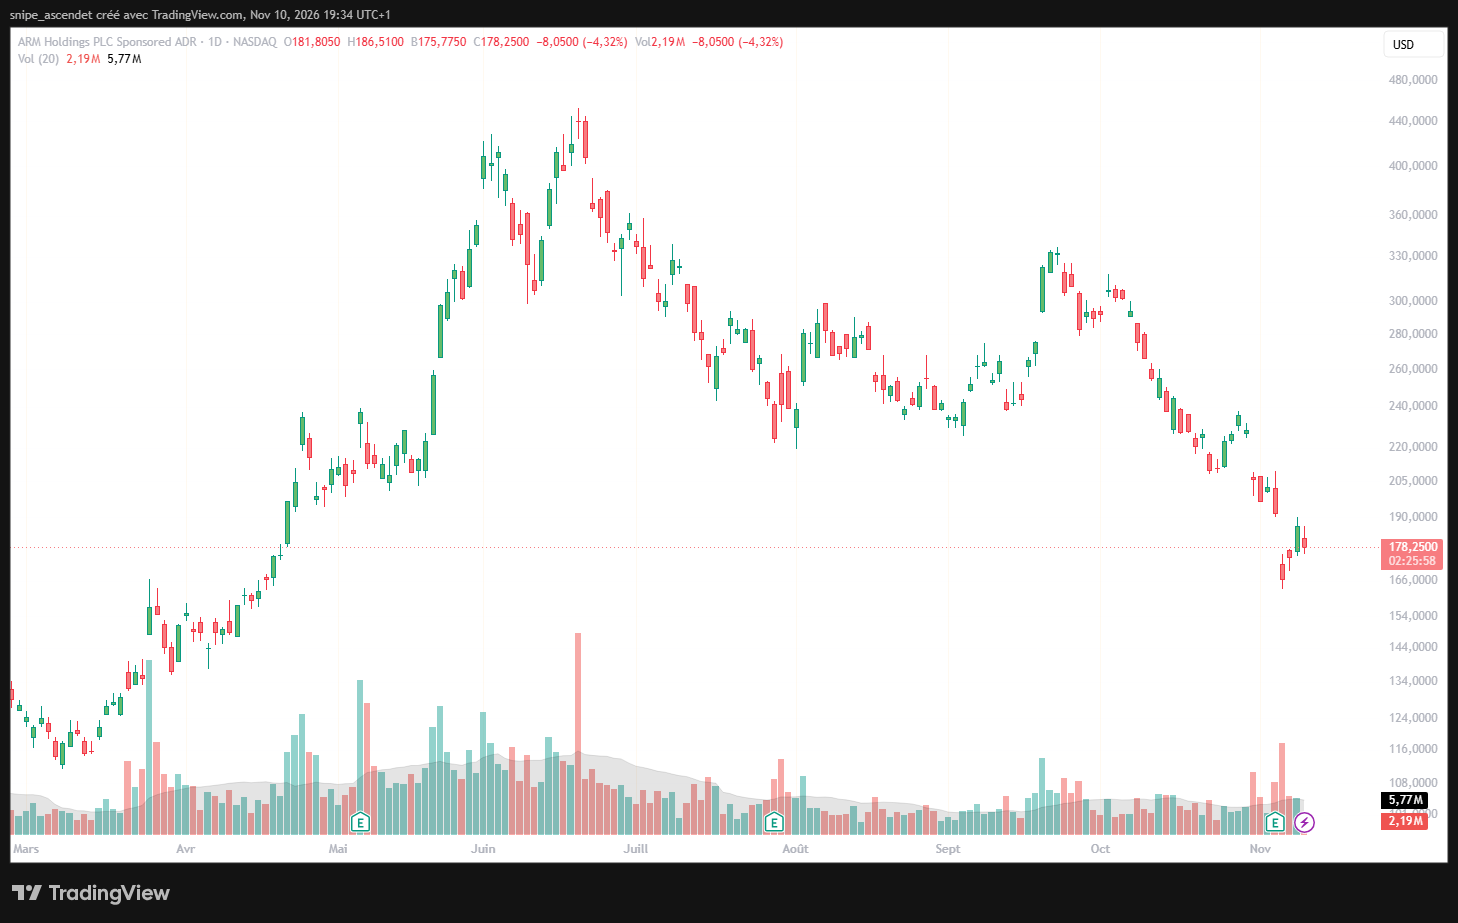
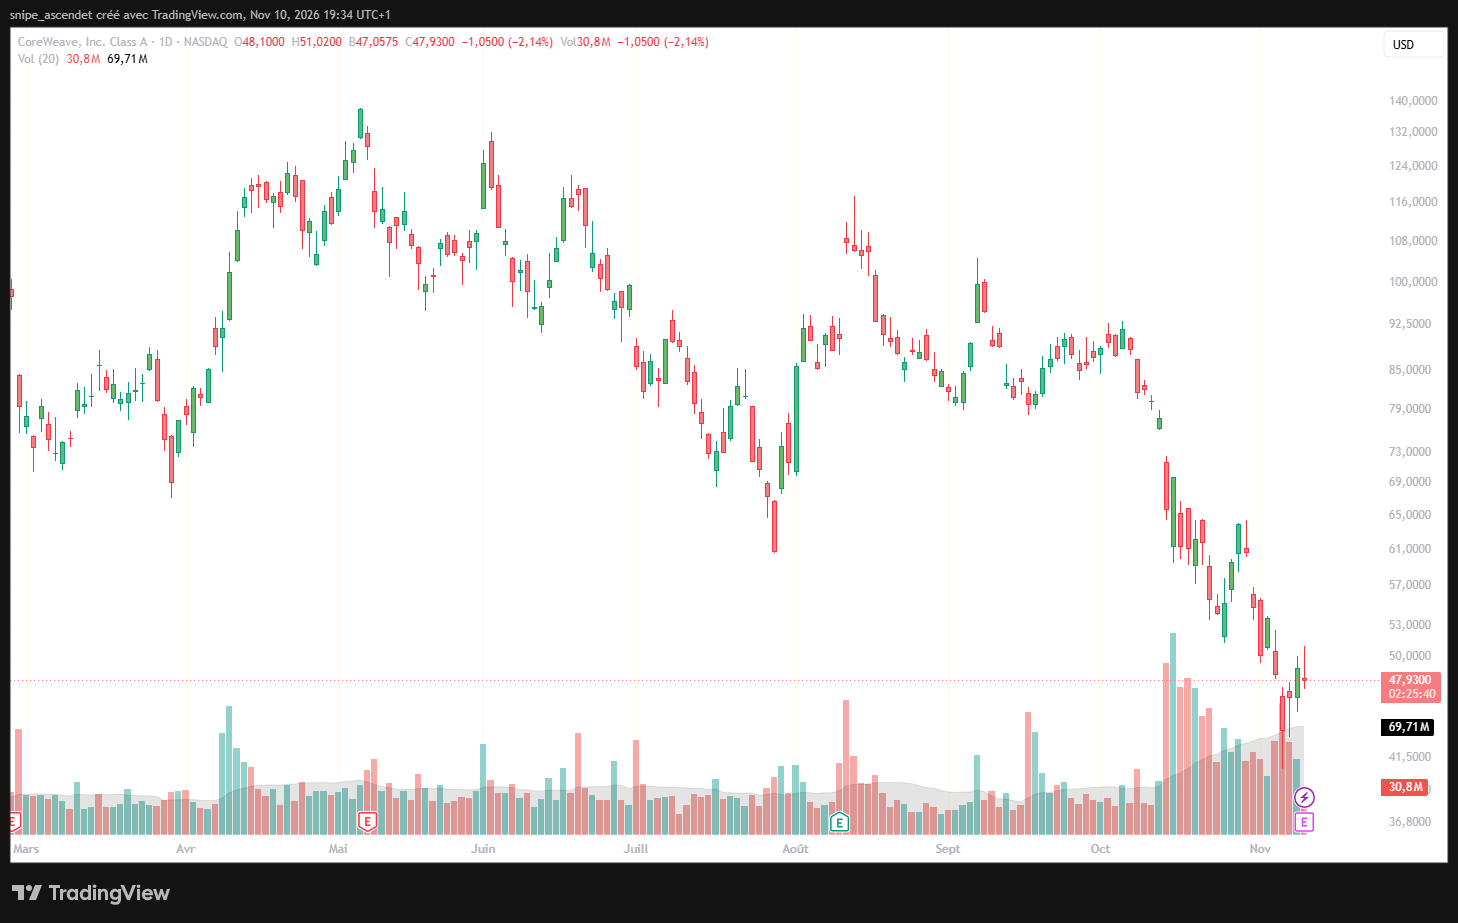
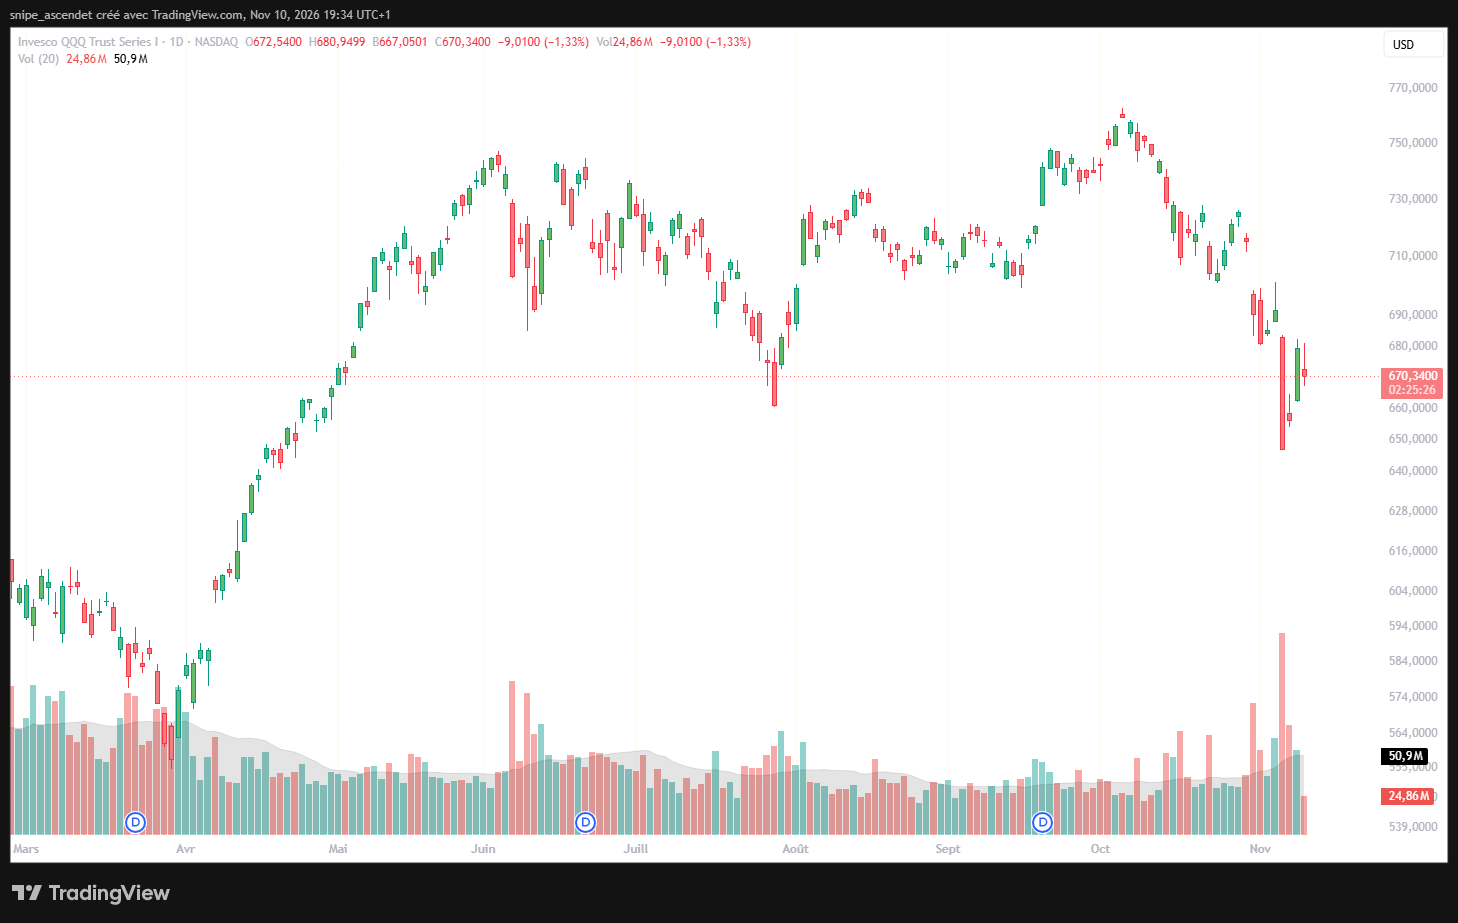
The U.S. stock charts supplied at approximately 1:34 p.m. Eastern on November 10 show Arm at $178.25 (−4.32% on the session), CoreWeave at $47.93 (−2.14%), and Invesco QQQ at $670.34 (−1.33%). They are intraday observations, not Nasdaq closing prices. Those three percentages share the same date and intraday snapshot, but individual company factors and different business models prevent a causal claim that SoftBank’s results drove the moves.
CoreWeave is a useful comparison because the AI financing issue is visible directly at the infrastructure operator. It faces the timing gap between building expensive computing capacity and receiving customer payments. Our comparison of CoreWeave, IREN, Nebius and Applied Digital debt analyzes that mismatch. SoftBank, by contrast, is exposed through a portfolio of investments, loans and project financing rather than through one standardized GPU-rental business.
The broader market backdrop also matters. The QQQ chart shows a recent drawdown after its autumn high, but a weak technology ETF by itself cannot identify the cause of changes in SoftBank’s credit quality. Concerns about the availability of electricity, infrastructure schedules and returns on capital reinforce one another. Our analysis of AI power companies and cash generation covers the operational side, while AMD versus Nvidia analysis illustrates why rising AI revenues do not automatically make every investment in the supply chain equally attractive.
Bull and Bear Cases: What Could Change the Credit Outlook?
Bull case: asset values and funding access stabilize
An improvement would require more than a single-session stock bounce. Arm and other listed holdings would need to stabilize, while OpenAI and the data-center portfolio demonstrate credible monetization pathways. Better terms on new debt, reduced reliance on collateral-backed borrowing and narrowing CDS spreads would provide more direct evidence of credit improvement. Future purchase rebates on the data-center equipment charge could also soften the reported loss, but their realization remains contingent.
Bear case: higher financing costs meet delayed AI returns
The adverse scenario combines expensive refinancing with falling collateral values, delayed project commissioning or disappointments in private-company valuations. A sustained increase in bond yields and CDS spreads could put pressure on future borrowing even if the reported holding-company LTV remains comfortably below any unspecified covenant limit. Forced sales, dilution, asset write-downs or changes to investment commitments would then become more consequential risks. There is no verified evidence from the cited materials that such an event is inevitable.
Five signals investors should monitor next
- CDS and bond pricing: whether five-year spreads and new-issue yields tighten or widen after the earnings announcement.
- Updated net asset value: subsequent Arm marks, private holdings valuations and holding-company adjusted LTV.
- Financing transactions: maturities, use of proceeds, collateral requirements and costs of new borrowings.
- OpenAI liquidity: verified funding terms, realizable investment value and any formal public-listing disclosures.
- Data-center execution: rebates, equipment procurement revisions, commissioning dates and cash returns on deployed capital.
Bottom Line: A Credit Warning, Not a Bankruptcy Verdict
SoftBank’s credit market is registering a clear rise in the price of protection against default, and its November 10 results show how AI-related execution costs can reach the income statement before anticipated returns arrive. But the viral 33% bankruptcy claim overstates what CDS data can establish. The verified signals are a four-year-high five-year spread on November 6, substantial additional financing, a ¥1.1 trillion quarterly loss and a reported 15.9% adjusted LTV as of September 30. The next decisive evidence will come from updated asset values, funding terms and cash realization, not from extrapolating one CDS quote into a definitive forecast of failure.
Methodology and timing: Financial amounts refer to the periods specified above; the ¥/USD equivalents quoted for the November 10 quarter follow Reuters. TradingView charts were captured on November 10 at 19:33–19:34 CET. Tokyo’s session was complete; the U.S. session was still underway. The circulating 493.43-basis-point CDS screenshot lacks an authenticated quote timestamp and is excluded from the published charts. This analysis is informational and is not personal investment advice.