


The Trade Desk (NASDAQ: TTD) reported $735.97 million in third-quarter 2026 revenue on November 9, beating the $651.44 million analyst consensus cited by Benzinga Pro by about $84.5 million. Adjusted earnings of $0.33 per share also topped the $0.25 estimate. Yet revenue still declined 0.5% from a year earlier, and the company’s adjusted EBITDA margin contracted to 36% from 43%. That gap between a surprise earnings beat and weak annual growth defines the TTD stock comeback debate.
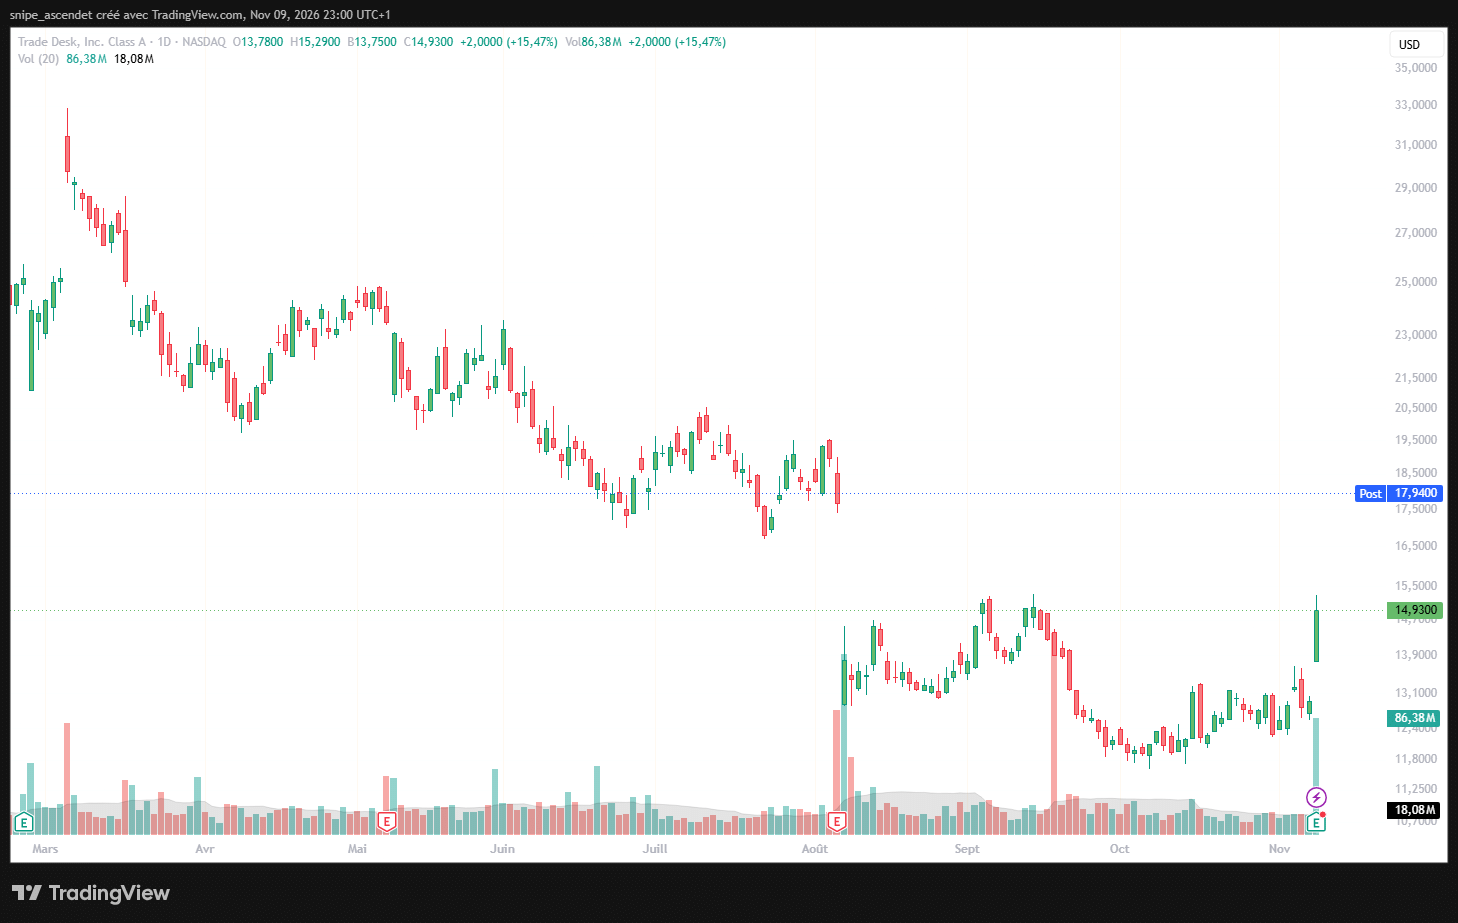
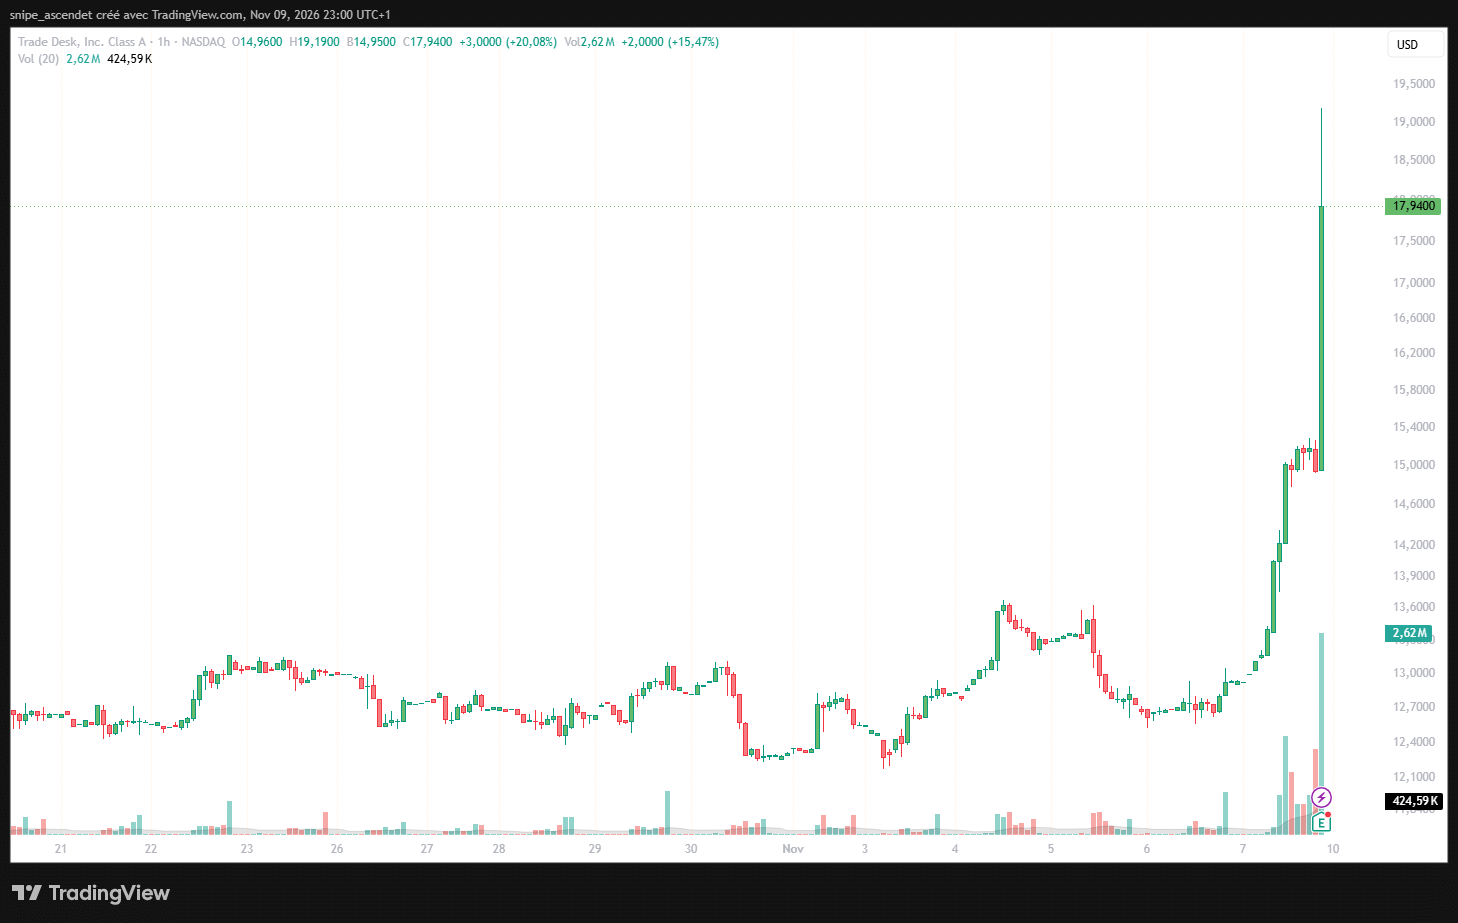
The market reaction was dramatic. TTD closed the regular Nasdaq session on November 9 at $14.93, up 15.47% according to the supplied TradingView chart, then showed an indicative $17.94 after-hours quote at approximately 5 p.m. Eastern, another 20.2% above that regular-session close. The post-market quotation is not an official closing price, and subsequent trading could differ substantially.
TTD Earnings: A Major Beat Against Reduced Expectations
The quarter was considerably stronger than the cautious outlook issued in August. The Trade Desk had guided for at least $650 million in revenue and roughly $160 million in adjusted EBITDA. The reported $735.97 million of revenue and $265.84 million of adjusted EBITDA therefore beat both management’s starting assumptions and widely tracked analyst projections. The pre-release Benzinga Pro consensus was $651.44 million for revenue and $0.25 for adjusted EPS; other estimate providers published somewhat different figures.
| Third-quarter metric | Reported | Expected | Difference |
|---|---|---|---|
| Revenue | $735.97 million | $651.44 million, Benzinga Pro | +$84.53 million (+13.0%) |
| Adjusted diluted EPS | $0.33 | $0.25, Benzinga Pro | +$0.08 (+32.0%) |
| Adjusted EBITDA | $265.84 million | Approximately $160 million, company guidance | +$105.84 million (+66.2%) |
| GAAP diluted EPS | $0.08 | No comparable verified GAAP consensus | Not calculated |
Sources: The Trade Desk’s November 9 earnings release, August second-quarter release and Q3 guidance, and Benzinga’s November 9 pre-earnings consensus. Company guidance is not an analyst consensus estimate.
Beating a low bar matters for a stock that had suffered a prolonged selloff. It does not establish that the business has returned to its previous growth profile. Revenue of $735.97 million was below the $739.43 million recorded in Q3 2025, while the year-earlier company had been growing by 18%. Revenue for the first nine months of 2026 was up 4%, versus 20% in the comparable period of 2025. The deceleration is still substantial.
Why TTD Stock Jumped, and What the Charts Actually Show
The hourly chart shows why the earnings announcement attracted such an intense reaction. The supplied screenshot records a post-results quote of $17.94 and an extended-hours high of $19.19 on November 9. That is sharp price discovery outside regular trading hours, when spreads and liquidity can differ from the daytime session. The initial surge should not be described as the next day’s confirmed return.
The regular-session move had already been strong: the daily chart shows a 15.47% gain to $14.93 on trading volume of about 86.38 million shares, compared with a displayed 20-session average of approximately 18.08 million. This combination indicates unusually active positioning around the announcement; it does not independently reveal whether those trades were institutional purchases, short covering or speculative activity.
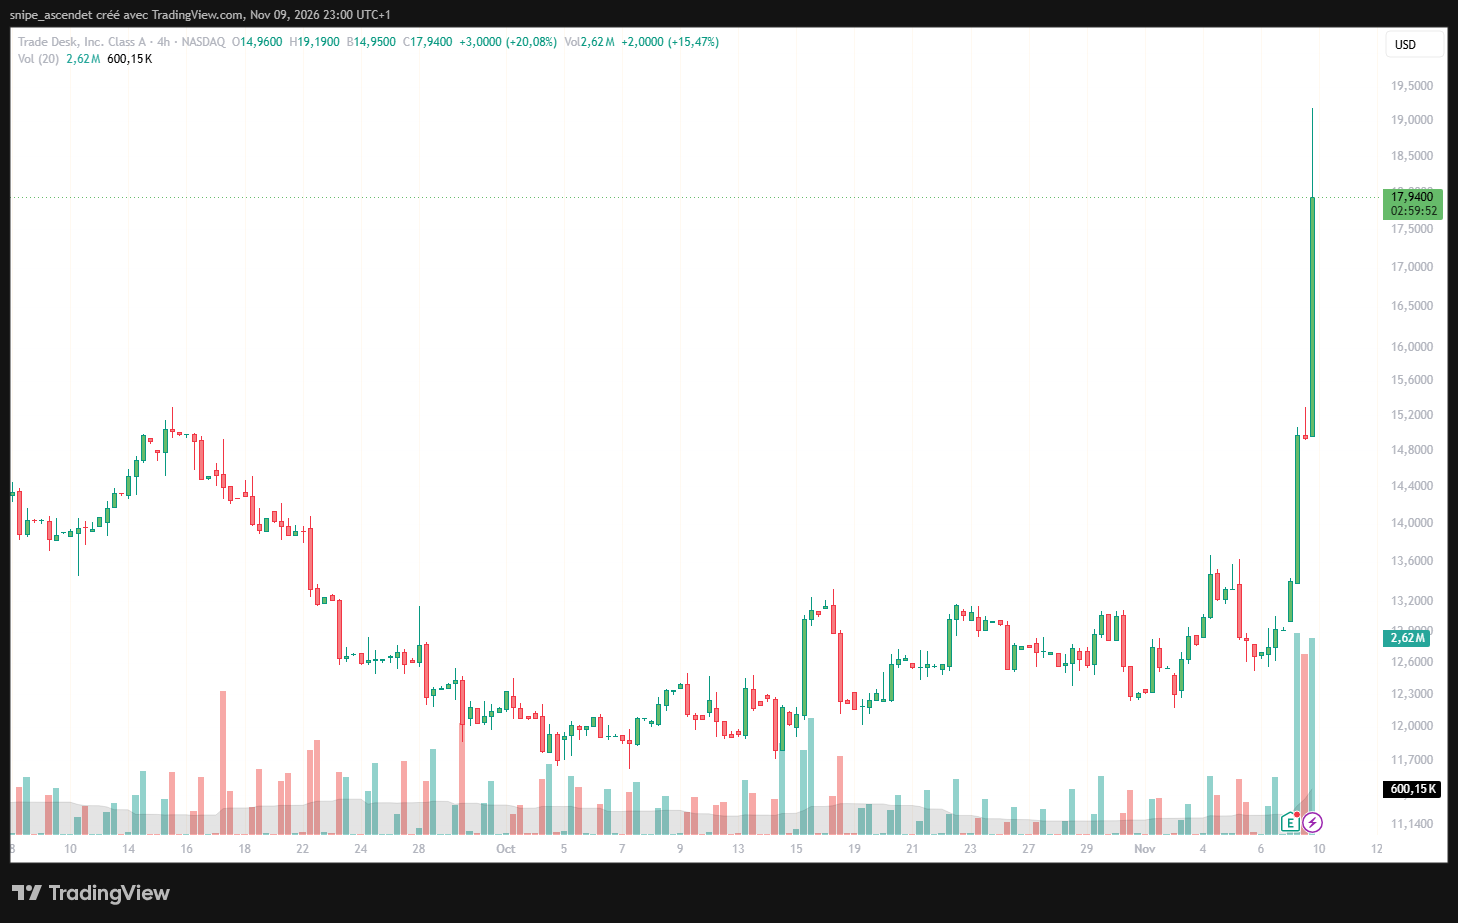
The four-hour view also makes clear how much repair is required. Through September and October, TTD experienced a persistent decline before rebounding into the release. A breakout can improve sentiment, but holding the higher range in subsequent regular sessions, rather than briefly touching it after hours, is the more useful confirmation for investors.
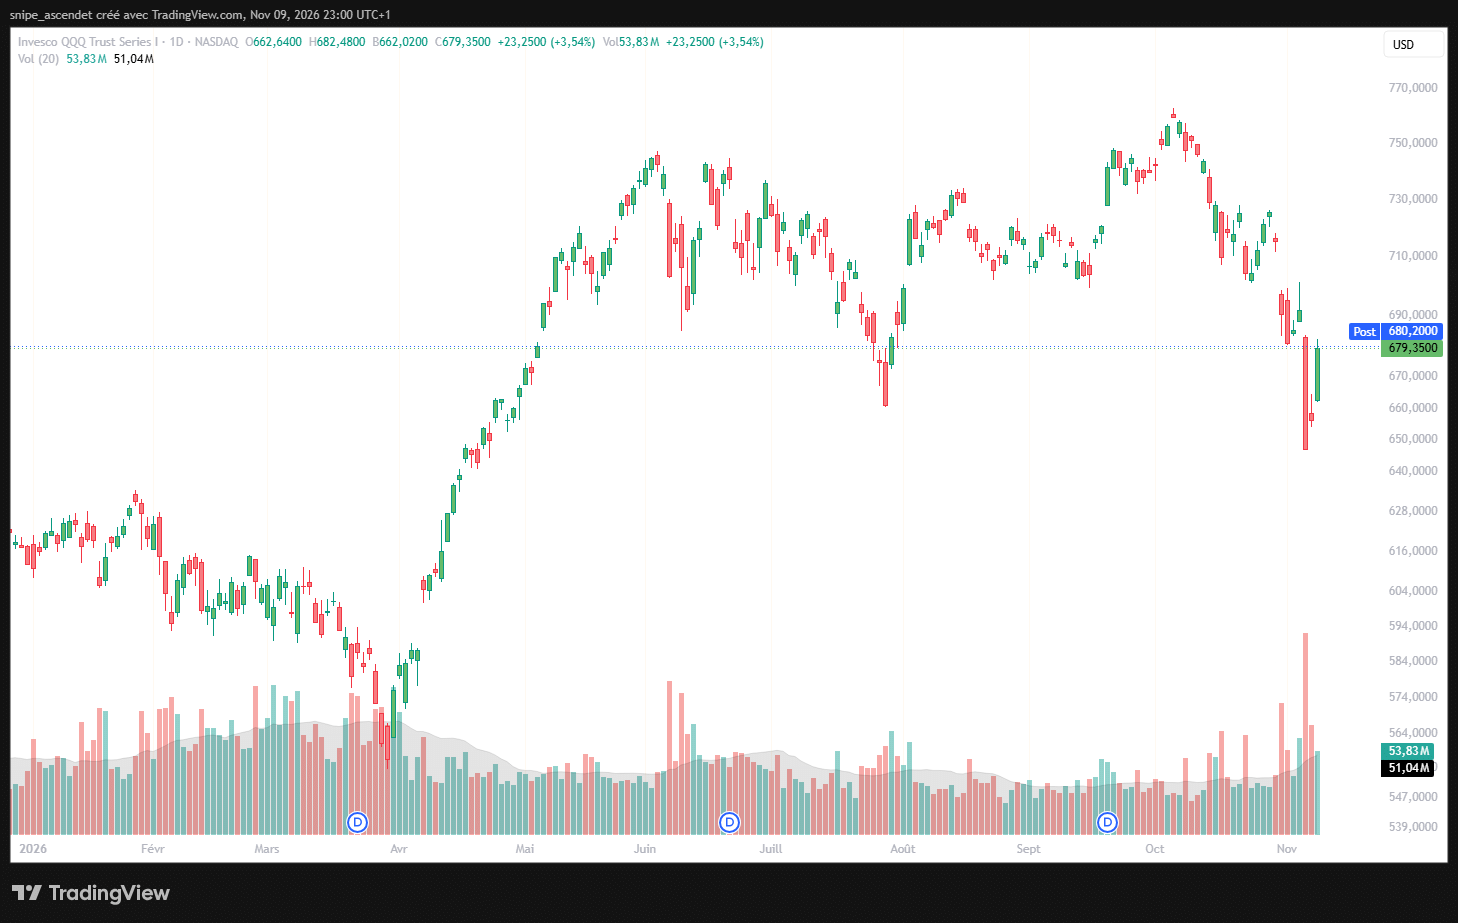
The broader market was positive on November 9 as well. The supplied QQQ daily chart shows a 3.54% regular-session gain. TTD’s 15.47% daytime advance was much larger, consistent with a company-specific catalyst on top of a supportive technology-market backdrop. For context on that backdrop, see DualFinances’ analysis of Wall Street’s fragile technology-stock rebound.
Profitability Remains the Central Weakness
The adjusted headline should not obscure the deterioration in reported profitability. The Trade Desk generated $38.05 million in GAAP net income, down from $115.55 million a year earlier. GAAP diluted EPS fell from $0.23 to $0.08. Adjusted EBITDA declined from $317.48 million to $265.84 million, and its margin decreased by seven percentage points to 36%.
Operating expenses rose to $643.36 million from $578.21 million, even as revenue slipped. Platform operations costs, sales and marketing, and technology investment were all higher than a year earlier. That operating leverage is running in the wrong direction: expenses are rising faster than revenue. The quarter also included $44.26 million in restructuring charges, primarily severance and other termination costs, which management excluded from adjusted profitability.
Stock-based compensation of $95.09 million in Q3 is another important distinction between reported and adjusted profit. Although it is a noncash accounting expense in the period, stock awards can dilute shareholders and should not be ignored when judging earnings quality. Management argues that its non-GAAP measures help illustrate operating performance, but those measures do not replace GAAP results.
Cash Flow and the $1 Billion Buyback Provide a Financial Cushion
The balance sheet offers a stronger counterweight to the margin concerns. At September 30, The Trade Desk held $1.23 billion in cash and cash equivalents plus $420.38 million in short-term investments, or approximately $1.65 billion combined. The published balance sheet does not list a conventional interest-bearing borrowing line, although the company has substantial operating payables and lease obligations. Cash should not be confused with cash freely available after all operating commitments.
Through the first nine months of 2026, net cash provided by operations reached $803.67 million. Deducting $226.75 million of property and equipment purchases and $11.57 million of capitalized software development costs yields roughly $565.36 million of cash after those investments. This is an editorial calculation from the disclosed cash-flow statement, not a company-defined free-cash-flow figure. Timing of payments from advertising customers and to publishers can materially affect the cash conversion profile.
Management also added $731 million to its share-repurchase authorization, raising the total available to $1 billion. The company repurchased $241.33 million of Class A stock during the first nine months of 2026. A larger authorization can reduce dilution or increase per-share ownership if implemented, but it is permission to repurchase shares, not a commitment to spend the full amount immediately. The distinction also applies to other technology-sector buybacks, as discussed in DualFinances’ coverage of Lam Research’s $25 billion repurchase authorization.
The Q4 Guidance Still Implies a Difficult Finish to 2026
For the fourth quarter, the company expects revenue of at least $755 million and adjusted EBITDA of at least $280 million. That is an improvement from the Q3 revenue level, but the revenue floor sits approximately 10.8% below the $846.79 million reported in Q4 2025. A minimum guidance figure is not a forecast of the final year-over-year decline: actual revenue could exceed the floor.
Adding the Q4 revenue floor to the $2.14 billion booked through September produces a minimum implied 2026 total of approximately $2.895 billion. That would be nearly flat against the $2.896 billion recorded in full-year 2025. The company would need to exceed its Q4 minimum to deliver meaningful full-year growth. This makes the next earnings cycle a direct test of whether the Q3 upside was the beginning of a recovery or a temporary improvement against depressed expectations.
The long-term product argument rests on the Kokai platform, Kokai Zuma’s agentic-AI functionality, measurement tools, and connected-TV inventory access. The company says customer retention remained above 95%. It also highlighted expanded Netflix advertising integrations and partnerships across healthcare measurement and premium streaming. These initiatives may support future demand, but the current filing does not quantify the incremental revenue they will generate. Investors should not treat product announcements as booked sales.
APP and MGNI Show the Advertising Market Is Not Moving in One Direction
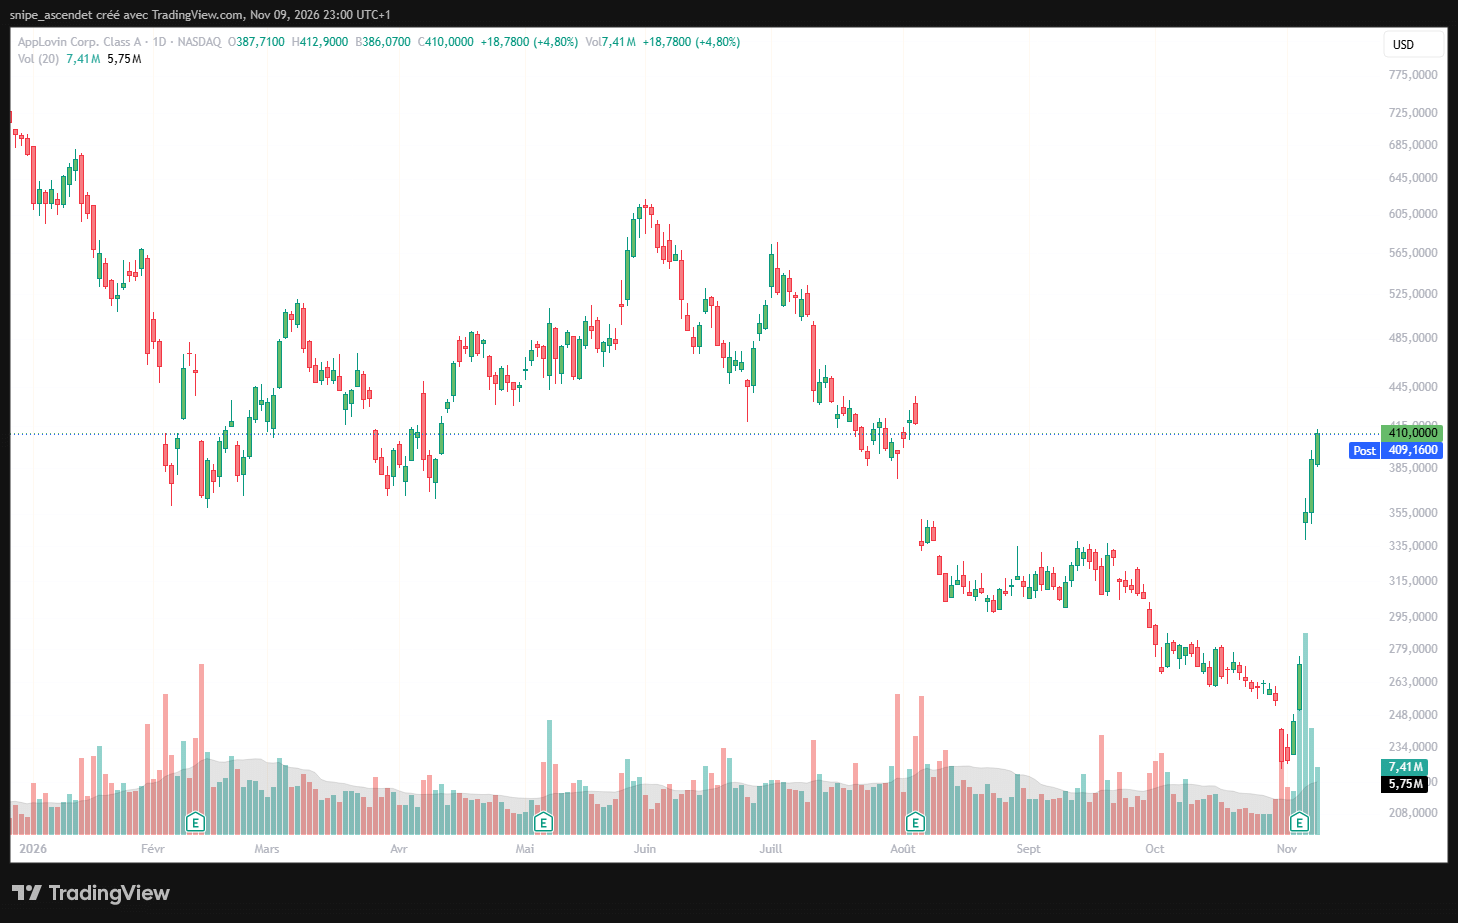
The competitive backdrop makes TTD’s slowdown more difficult to dismiss as a uniform industry downturn. AppLovin reported third-quarter 2026 revenue of $2.185 billion, an increase of 55% year over year, alongside an 84% adjusted EBITDA margin. AppLovin’s advertising model and customer mix differ from The Trade Desk’s independent demand-side platform, so its reported economics are not a direct operating benchmark. Its growth nevertheless provides a meaningful contrast in how investors may value advertising technology businesses.
On the sell side, Magnite reported $204.2 million in Q3 revenue, up 14%, while connected-TV contribution excluding traffic-acquisition costs rose 39%. Magnite is a supply-side platform, and its ex-TAC contribution metric cannot be placed alongside TTD’s recognized revenue as if they were identical. Still, the CTV performance suggests that demand in portions of the digital advertising ecosystem remains resilient.
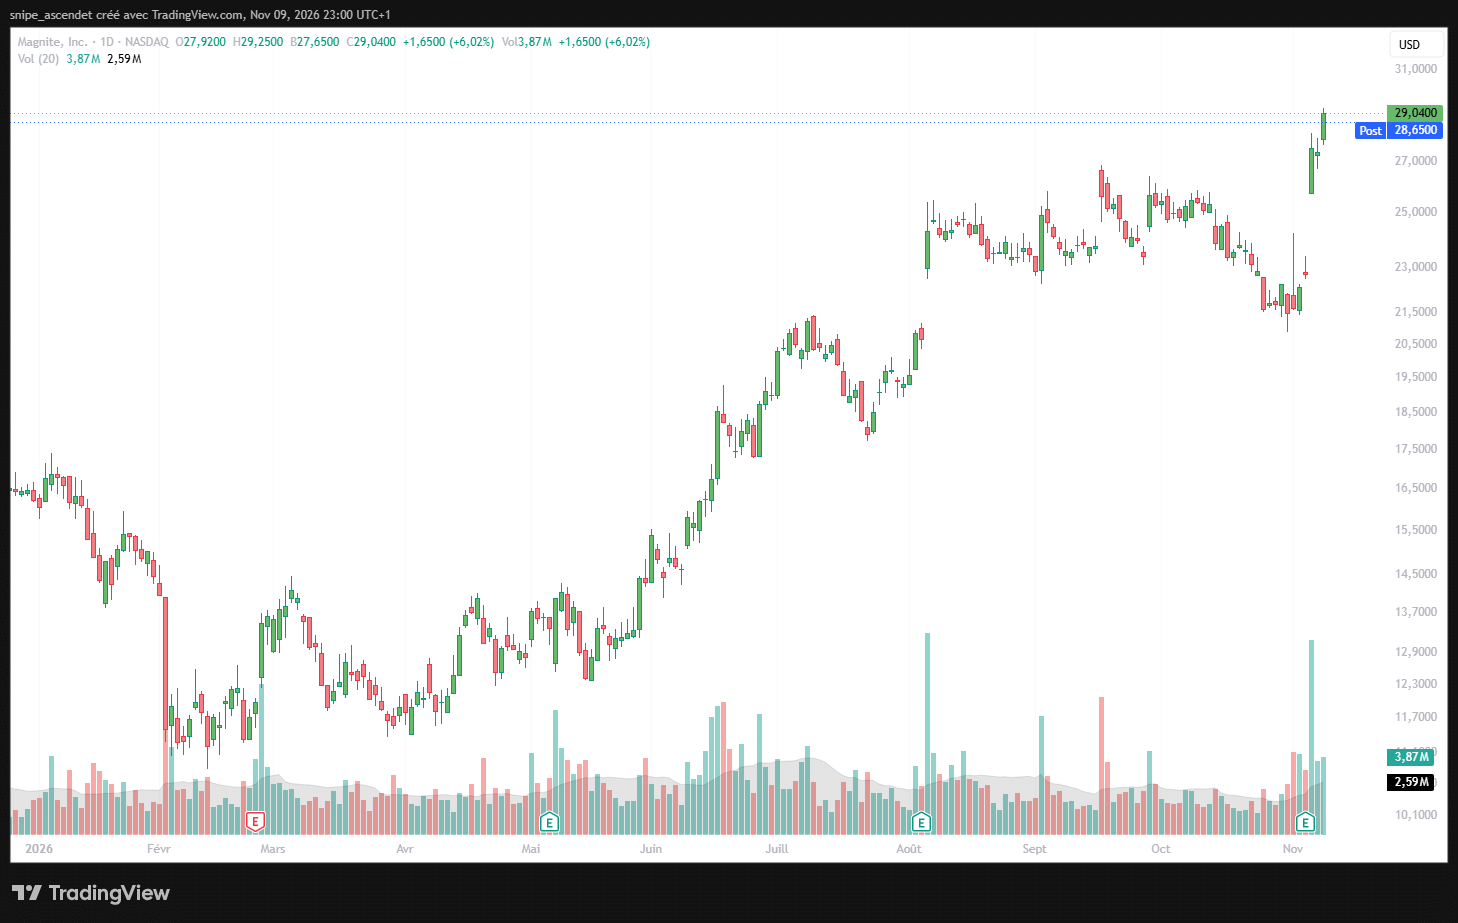
On the supplied November 9 daily charts, APP gained 4.80% to $410.00 and MGNI gained 6.02% to $29.04, compared with TTD’s 15.47% rise to $14.93. All three figures refer to the same regular trading session, avoiding the misleading comparison of one stock’s after-hours quote with another stock’s official close. The Cloudflare-versus-Akamai growth comparison provides another example of why growth rates and valuation expectations need to be assessed together rather than in isolation.
Valuation and the Conditions for a Sustained Comeback
At this stage, investors are being asked to price a recovery that management has not yet demonstrated in annual revenue growth. Using roughly 470 million diluted weighted-average shares for Q3 as an illustrative share-count proxy, the $14.93 November 9 regular close corresponds to an approximate equity value of $7.0 billion. The $17.94 after-hours quotation would imply roughly $8.4 billion on that same simplified basis. These are not definitive market-cap figures: weighted-average shares are not the exact period-end outstanding count, and after-hours quotations can change rapidly.
Against approximately $2.987 billion in revenue over the last four reported quarters, those illustrative equity values represent about 2.35 times and 2.82 times trailing sales, respectively. These are equity-value-to-sales comparisons, not enterprise-value multiples, and exclude differences in net cash, dilution and growth trajectories. A lower multiple than the stock carried during its faster-growth period is not automatically evidence of undervaluation.
The constructive case is that the Q3 beat marks the bottom in expectations. Execution improves, connected-TV and AI products contribute measurable sales, margins recover, and repurchases support per-share economics. The opposing case is that TTD experiences a prolonged period of low growth while costs remain elevated, making even a much lower stock valuation difficult to justify.
The key question is not whether TTD can rally after earnings. It already has. It is whether the next two quarters can show a sustained improvement in reported revenue growth, adjusted margins and GAAP earnings. Until those trends improve together, the November 9 move is best understood as a forceful repricing of expectations, not yet proof of a completed turnaround.
This article is for general information only and is not personalized investment advice. Market-price references are based on supplied TradingView screenshots captured November 9, 2026, at approximately 11 p.m. Paris time (5 p.m. Eastern).