


Hims & Hers Health grew third-quarter 2026 revenue 49% to $890.4 million, yet the online-care company reported a $33.0 million GAAP net loss, a sharp fall in cash generation and a 17-percentage-point drop in gross margin. The disconnect matters more than the headline growth rate: the business is selling much more, but keeping less of each revenue dollar before overhead. The results were released on November 9 for the quarter ended September 30, according to the company’s earnings statement.
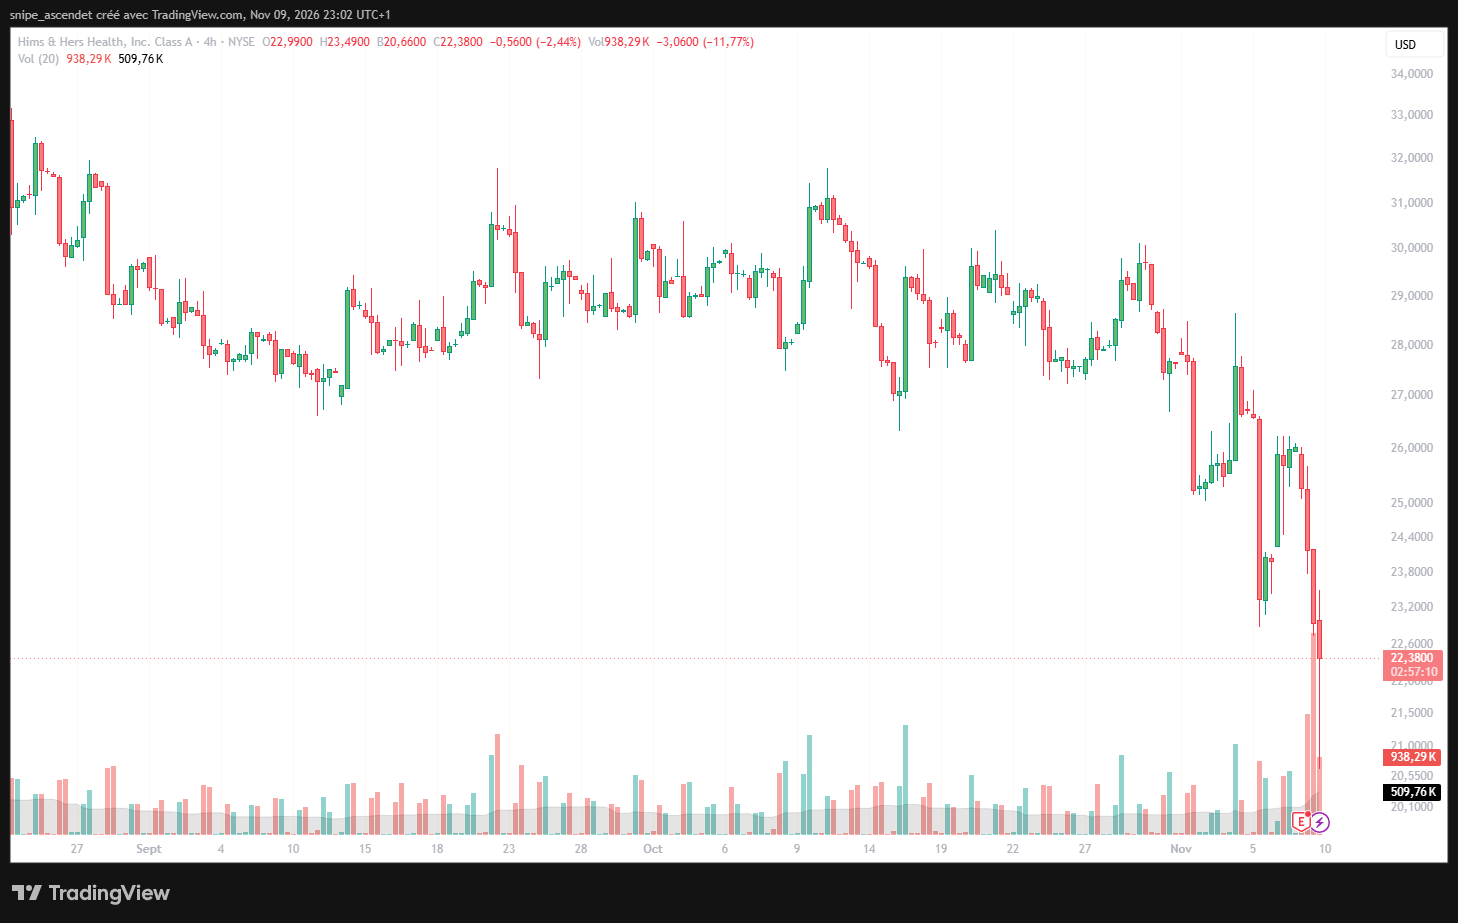
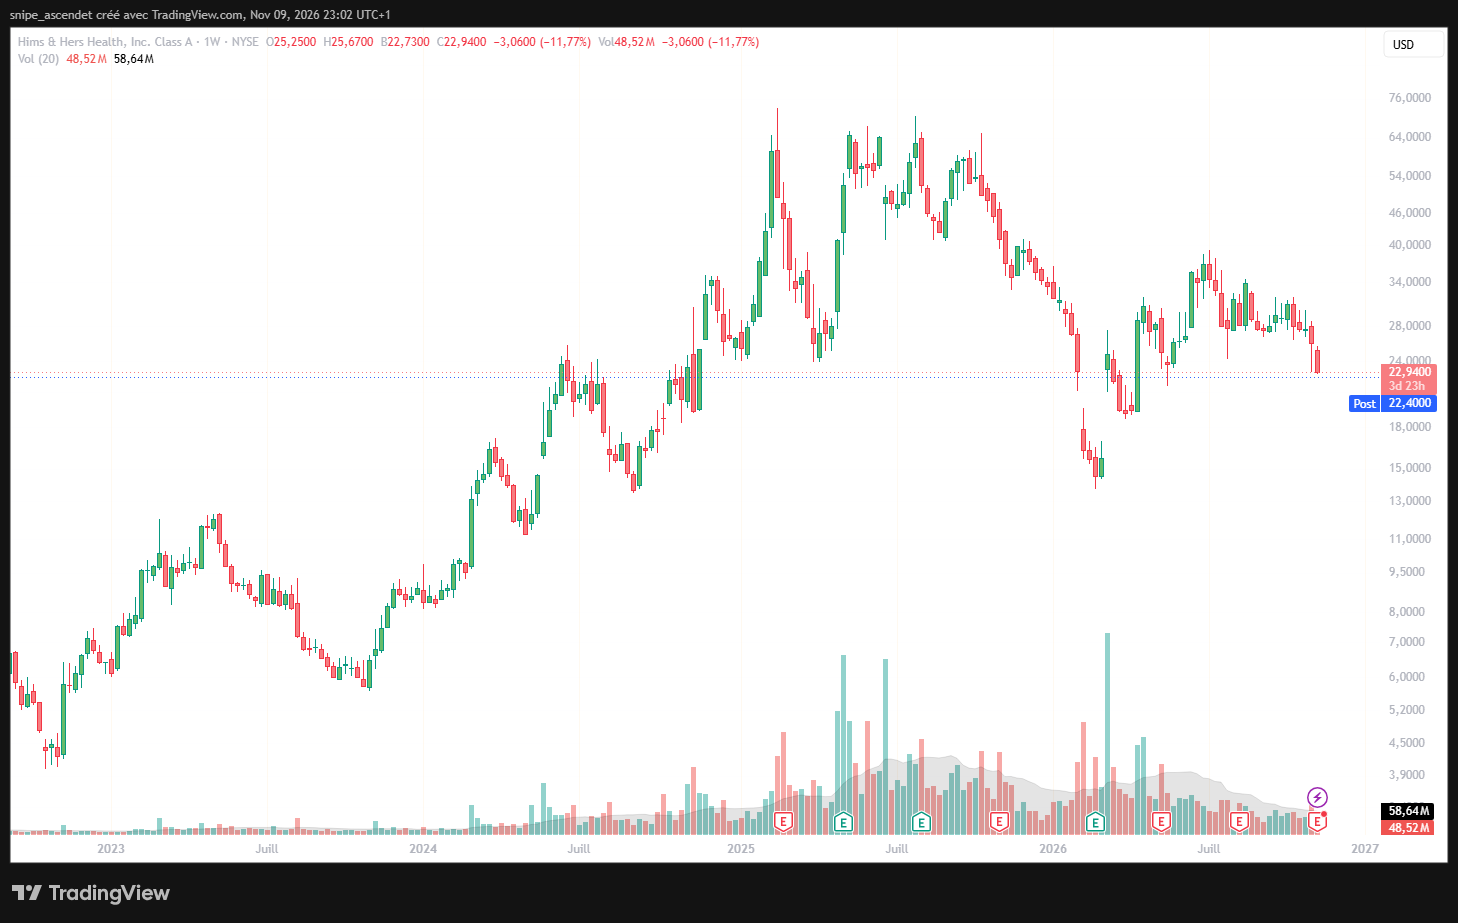
HIMS shares had already fallen 11.77% in the November 9 regular session to $22.94, before the after-the-bell results. The supplied TradingView captures show an additional, fluctuating after-hours indication near $22.40, not an official closing price. Investors are now weighing whether expansion into branded obesity treatments and international telehealth can ultimately restore margins and free cash flow.
HIMS earnings versus Wall Street expectations
The revenue miss was modest, but the earnings surprise was substantial. LSEG consensus cited by Reuters called for about $892.9 million in sales. Separately, StreetInsider’s estimate snapshot put consensus GAAP earnings at $0.06 per share, versus the reported diluted loss of $0.14.
| Q3 2026 metric | Reported | Expected | Difference |
|---|---|---|---|
| Revenue | $890.4M | $892.9M (LSEG) | -$2.5M, approximately -0.3% |
| GAAP diluted EPS | -$0.14 | +$0.06 (StreetInsider consensus) | -$0.20 per share |
Hims & Hers reduced its full-year adjusted EBITDA forecast to $257 million–$277 million, from $275 million–$325 million previously. The new midpoint of $267 million is $33 million below the previous $300 million midpoint. Full-year revenue guidance was narrowed to $3.13 billion–$3.15 billion from $3.10 billion–$3.30 billion, while the fourth-quarter revenue outlook is $875 million–$895 million. These are management forecasts, not realized results.
Where the 49% revenue growth came from
The company reported $657.1 million of US revenue, up 21%, and $233.3 million outside the United States, up 321% from $55.5 million. International operations represented roughly 26% of quarterly sales, compared with about 9% a year earlier. This is a significant change in the revenue mix, although acquisition-driven and organic expansion cannot be treated as interchangeable.
In June 2026, Hims & Hers acquired Australian digital-health operator Eucalyptus. The second-quarter SEC filing describes an accounting purchase price of approximately $968.5 million, including deferred and contingent consideration, and operations across markets including Australia, the UK, Canada and Japan. That transaction helps explain why international revenue growth must be assessed alongside integration costs and future payment obligations.
The customer picture also has two sides. Subscribers increased 13% to 2.788 million, while monthly revenue per average subscriber rose 30% to $105 from $81. More revenue per customer can reflect stronger product mix or higher-priced treatment plans, but does not automatically mean that contribution profit or customer lifetime value is rising at the same pace.
Gross margin is the clearest warning sign
Gross profit grew from $442.1 million to $509.2 million, or about 15%, despite the 49% revenue surge. Cost of revenue climbed from $156.9 million to $381.2 million, an increase of roughly 143%. The result was a gross margin of 57%, down from 74%. Those numbers describe a material change in unit economics, not merely a weak bottom-line comparison distorted by financing items.
The company’s transition toward higher-cost branded weight-loss drugs and its international buildout are central factors in this pressure, according to Reuters’ earnings report. The key unknown is whether branded medicines improve retention and patient reach sufficiently to compensate for lower gross margins. No public pricing arrangement establishes how much profit Hims earns on an individual Eli Lilly prescription.
Marketing expense rose only about 7%, from $232.2 million to $247.3 million, and fell as a share of revenue. However, operations and support rose to $107.2 million from $76.8 million, technology and development to $69.4 million from $40.6 million, and general and administrative expense to $151.5 million from $80.7 million. These figures show that marketing alone is not the explanation for the earnings deterioration.
Adjusted EBITDA was $82.4 million, up only about 5% year over year, and its margin narrowed to approximately 9% from 13%. Under GAAP, the company recorded a $66.1 million operating loss, reversing $11.8 million of operating income in the prior-year period. It also booked $64.5 million in stock-based compensation, versus $40.2 million one year earlier. Adjusted profitability and shareholder-level profitability therefore tell different stories, an accounting distinction that also appears in our Cloudflare versus Akamai margin analysis.
Free cash flow fell faster than revenue rose
Operating cash flow dropped to $65.4 million from $148.7 million, while free cash flow fell to $26.0 million from $79.4 million. That is a roughly 67% year-over-year decline in free cash flow. For the first nine months of 2026, free cash flow totaled only $10.8 million, down from $60.0 million in the comparable 2025 period.
The quarter’s free cash flow calculation subtracts $33.3 million of spending on property, equipment and intangibles, plus $6.1 million of capitalized software and website investment, from operating cash flow. Capital expenditure matters, but the larger deterioration this quarter was in cash generated by operations before those investment deductions.
At September 30, Hims held $605.6 million in cash and equivalents and $106.6 million in short-term available-for-sale investments. Against this, the balance sheet listed $1.37 billion in convertible senior notes, plus substantial deferred acquisition payments and contingent consideration. Receivables also rose to $427.8 million from $32.1 million at year-end 2025. The company has liquidity, but cash on hand should not be described as debt-free financial flexibility.
The wider question resembles the one in our analysis of high-growth electricity companies: rapid sales expansion can coexist with weak cash conversion. Hims must demonstrate that its current expansion phase eventually produces cash after working-capital requirements, acquisition settlements and reinvestment.
Eli Lilly and Novo Nordisk bring access, but also a margin test
On November 6, Eli Lilly and Hims & Hers announced an arrangement that allows eligible users to access FDA-approved Zepbound and Foundayo through the Hims platform following a clinician’s prescription. Advertised self-pay starting prices are $299 a month for Zepbound and $149 for Foundayo. These prices are patient-facing drug prices, not Hims revenue per subscriber or a disclosed commission rate.
Hims had already changed its relationship with Novo Nordisk. In March, Novo announced a new agreement to make approved Wegovy and Ozempic treatments available through Hims following an earlier dispute over compounded products. The shift from compounded offerings to manufacturer-branded treatments can broaden the platform’s legitimacy and product range, while also increasing dependence on pharmaceutical partners and their pricing policies.
Neither partnership proves that the company will capture attractive incremental margins. The upside case is that more recognizable treatments attract and retain patients, supporting follow-on care and subscriptions. The downside is that larger medication sales inflate revenue while leaving relatively little gross profit after drug acquisition, support and fulfillment expenses.
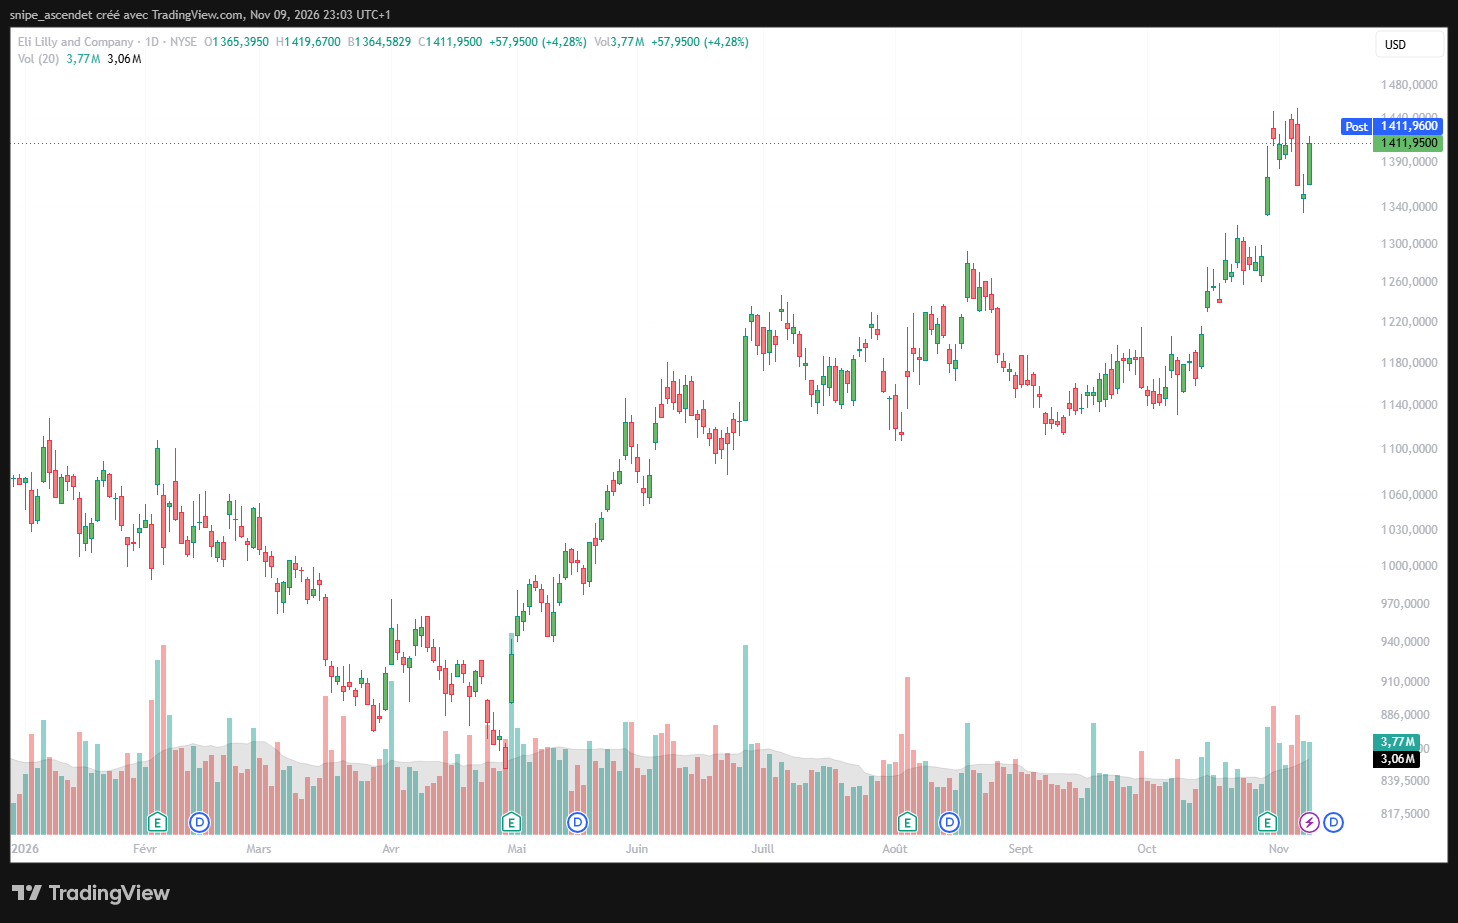
Eli Lilly’s stock has a markedly stronger uptrend on the supplied daily chart, but the chart cannot isolate the effect of the Hims partnership from drug-development updates, company earnings and broader pharmaceutical-sector factors.
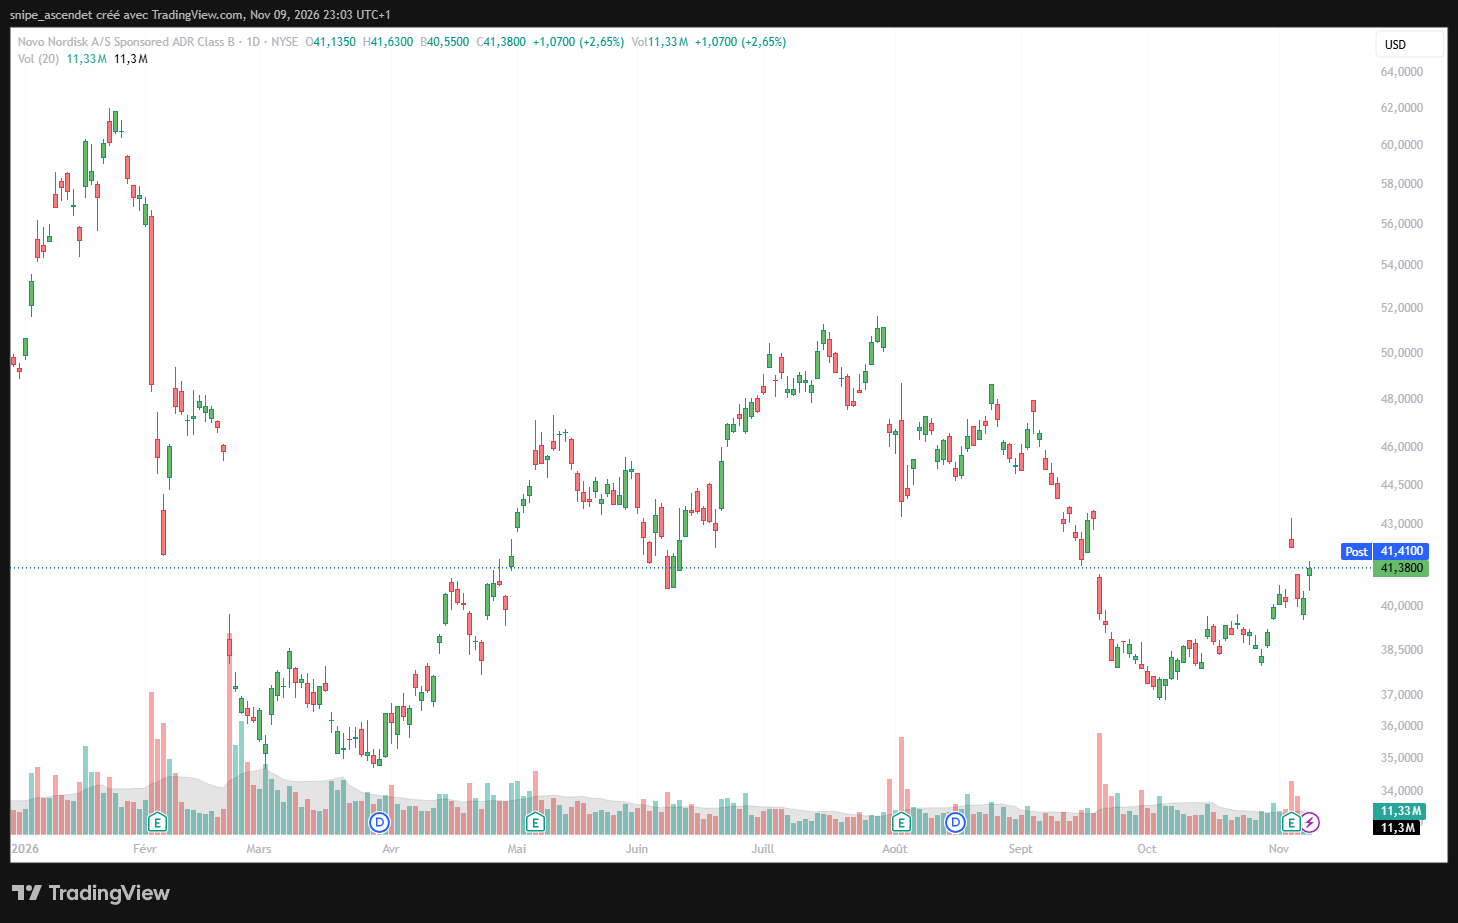
Novo Nordisk’s US-listed ADR shows a different price history over the same calendar year. LLY and NVO have different share prices, capitalizations and underlying business models, so their absolute dollar levels are not meaningful valuation comparisons. Both charts offer pharmaceutical-sector context rather than proof that Hims inherits the manufacturers’ economics.
What the HIMS selloff actually shows
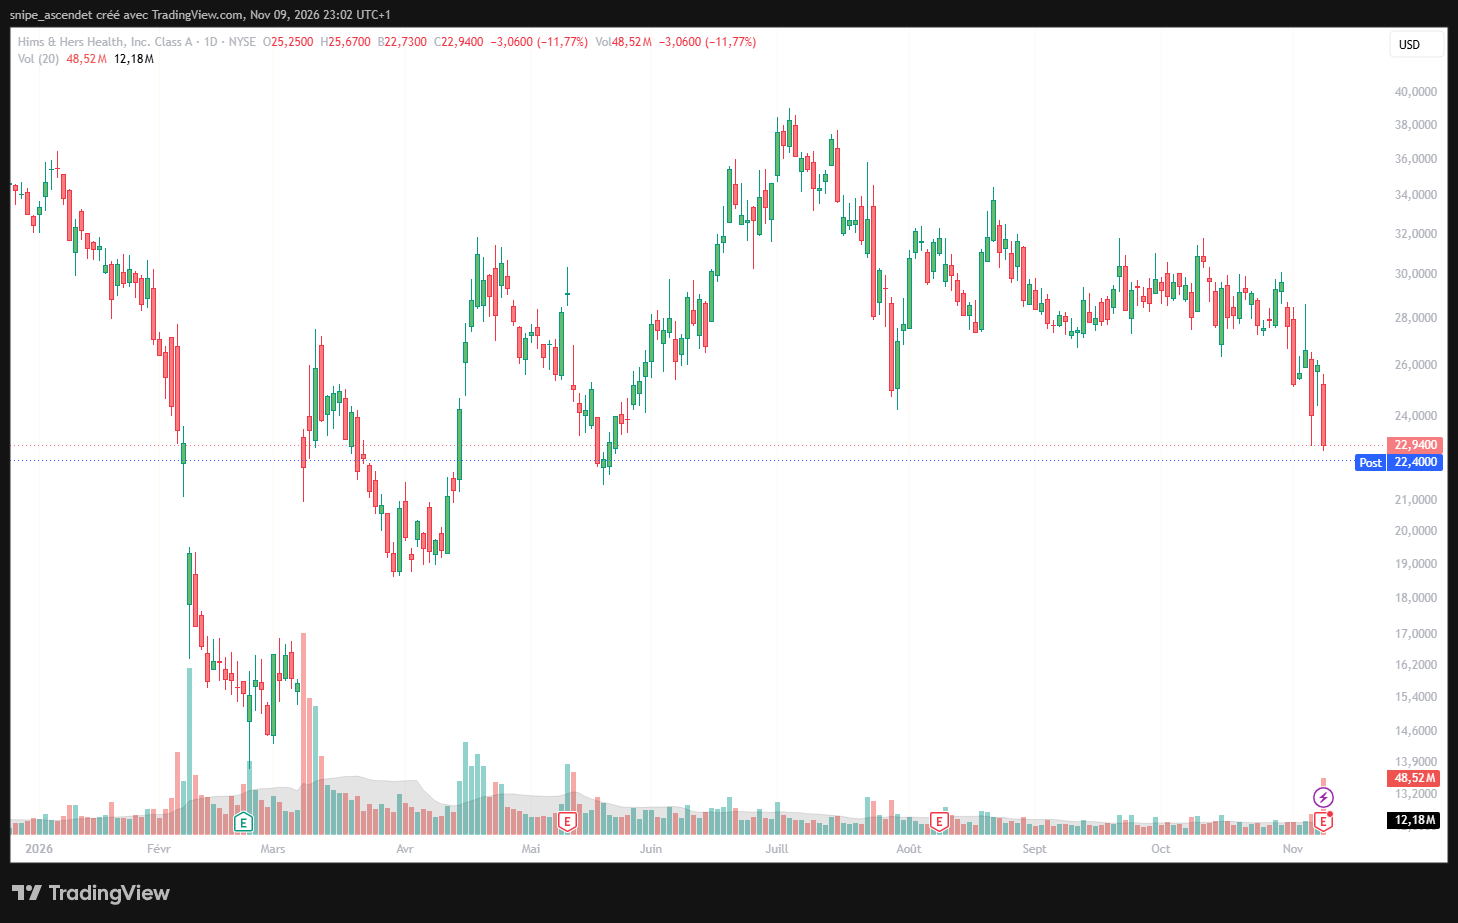
The November 9 regular session delivered an 11.77% HIMS decline on approximately 48.5 million shares, around four times the 20-session average volume displayed in the supplied daily chart. Crucially, that regular-session drop preceded the earnings release. The after-hours quote near $22.40 shows additional selling interest in a thinner market, but is not a final settlement price or evidence of where HIMS will open the next day.
On the weekly chart, HIMS sits well below its 2025 highs and has given up much of the prior surge. The long-term chart shows high volatility in both directions; a high-volume one-day selloff may signal a reassessment of forecasts, but it cannot independently establish that the stock is cheap or expensive.
It is worth distinguishing this setup from a simple earnings disappointment. In our DraftKings earnings analysis, profit guidance and investment intensity also mattered more than revenue growth alone. For Hims, the repricing question centers on the amount of gross profit and cash that can survive its expanding product and geographic mix.
Bull and bear cases: the metrics that will decide
The bullish case
The growth thesis strengthens if Hims retains its much larger customer base, increases revenue per subscriber without further damaging gross margin, and begins recovering cash flow as international businesses integrate. Access to FDA-approved products from two major manufacturers could reduce friction for eligible patients. A stabilization of operating expenses, improved working-capital conversion and consistent adjusted EBITDA delivery would be more persuasive than subscriber or revenue growth alone.
The bearish case
The risk is that branded medication distribution sustains a lower structural margin, while integration costs, legal and compliance exposure, payment obligations and share-based compensation weigh on common shareholders. High reported revenue growth could persist even as GAAP losses and working-capital requirements consume its benefits. Because some 2026 revenue expansion came through acquisitions, investors also need a clear picture of underlying organic performance.
What investors should watch next
The next test is the fourth-quarter outlook: $875 million–$895 million in revenue and $70 million–$90 million in adjusted EBITDA. Important disclosures will include US versus international growth, actual gross margin, subscriber retention and revenue per subscriber, operating cash flow, free cash flow, and the pace of acquisition-related payments. Investors should also watch for more detail on branded-drug unit economics, rather than treating the partnerships themselves as proof of future margins.
Bottom line: Hims & Hers has demonstrated powerful revenue demand, but Q3 2026 also showed deteriorating gross economics, an unexpected GAAP loss and substantially weaker cash conversion. The investment case now depends less on how quickly the company can add sales than on how much of those sales ultimately reaches shareholders as durable earnings and free cash flow.
Data note: Financial information reflects the release dated November 9, 2026. Regular-session HIMS prices are for November 9; after-hours prices are indications visible on the supplied TradingView snapshots taken around 11:02 p.m. Central European Time and may change. This article is for information only, not individualized investment advice.