


The U.S. Treasury’s $42 billion 10-year note auction on November 10, 2026 cleared at a reported 5.020% high yield, according to live auction data published by Helious. The same service reported a 2.46 bid-to-cover ratio and 61.2% of competitive awards to indirect bidders, a weaker demand profile than October’s 10-year reopening. The auction arrived hours after a hotter-than-expected inflation report drove the benchmark 10-year market yield back above 5%.
The distinction between an auction result and a continuously traded market yield is essential. The 5.020% figure is the reported auction stop-out yield. A separate TradingView screenshot shows TVC:US10Y at about 5.008% around 1:19 p.m. Eastern on November 10. The figures measure different transactions and observation points, so they need not match. At the latest verification, the TreasuryDirect auction-results page did not expose a directly readable result for independent confirmation of every auction statistic. The breakdown below is therefore expressly attributed to Helious live auction data.
November 10 Auction: The Numbers Investors Need
| Measure | November 10 report | October 7 auction |
|---|---|---|
| Amount offered | $42 billion | $39 billion |
| High / stop-out yield | 5.020% | 5.300% |
| Bid-to-cover ratio | 2.46x | 2.77x |
| Indirect bidders | 61.2% | 80.3% |
| Direct bidders | 29.0% | 17.1% |
| Primary dealers | 9.8% | 2.5% |
| When-issued tail | +1.0 basis point | −1.7 basis points |
Sources: November 10 auction data and when-issued comparison from Helious; October 7 auction figures from historical 10-year note auction records. Dealer and bidder shares refer to competitive awards. The quoted November 10 tail uses Helious’s when-issued reference, which is not itself an official Treasury auction statistic.
The weaker bid-to-cover ratio matters because it compares total bids submitted with the amount sold. A reading of 2.46 means bidders sought roughly 2.46 times the securities offered, not that 2.46 times the offered amount was issued. The ratio is lower than October’s 2.77; it indicates softer bidding relative to that auction, although a single comparison cannot measure every dimension of underlying demand.
Why a One-Basis-Point Tail Matters
Helious placed the when-issued yield around 5.010% immediately before the auction and the clearing yield at 5.020%. The resulting +1.0 basis point tail means buyers required a marginally higher yield than the preauction trading level to absorb the supply. By contrast, October’s auction cleared 1.7 basis points through its when-issued level, which was a stronger price result at that time.
A small positive tail is not a failed auction. All the securities were allocated, and a meaningful share went to direct bidders. But the combination of a lower cover ratio and smaller indirect share suggests demand was less aggressive than in the previous reopening, particularly among investors bidding through intermediaries. Indirect accounts can include foreign institutions but are not a direct measure of foreign central-bank purchases.
US10Y Surges Above 5% After the CPI Surprise
The timing amplified the auction’s significance. In the morning, the Bureau of Labor Statistics said headline CPI rose 0.4% in October versus a 0.3% consensus, while core CPI rose 0.3% versus 0.2% expected. The 10-year market yield moved above 5%, and the supplied TVC:US10Y one-hour chart later showed a quote of 5.008%. The chart’s daily change was +0.124 percentage points, or 12.4 basis points, at capture time. This reflects market trading, not the Treasury’s borrowing cost at auction.
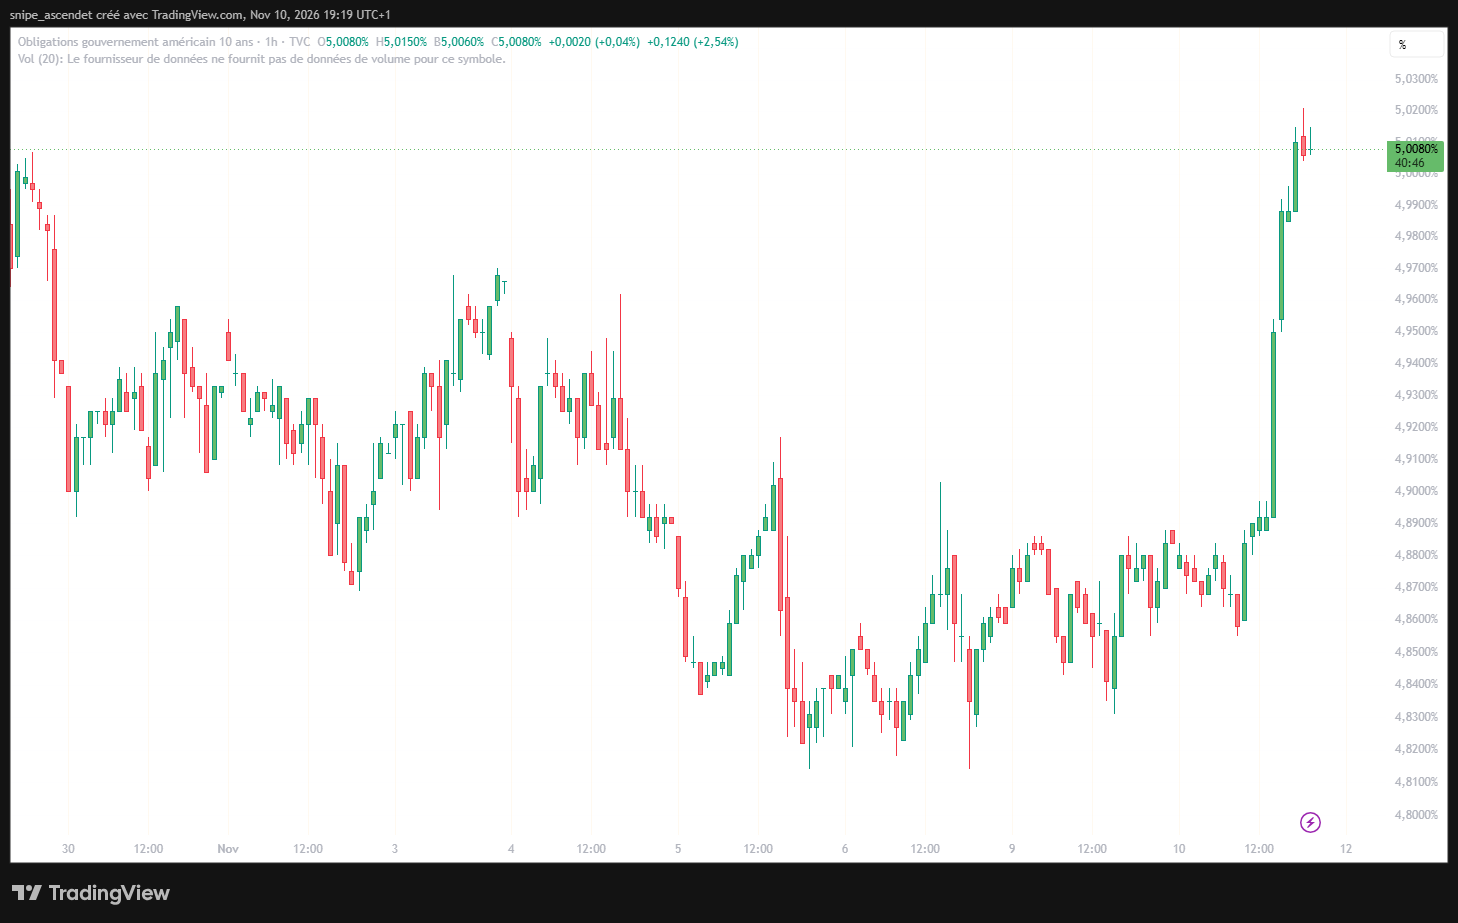
Bond prices and yields move inversely. When market yields rise sharply, outstanding fixed-rate Treasuries with lower coupons typically lose value. The US10Y benchmark is also used as a reference in corporate borrowing, mortgages and equity discount-rate assumptions, although borrowers do not automatically finance at exactly the Treasury yield. This DCF explainer shows how a higher risk-free rate can reduce estimated equity values without a change in projected cash flows.
How the $42 Billion Sale Fits the Treasury’s Refunding Plan
The Treasury’s November 4 refunding statement scheduled $125 billion of coupon auctions: $58 billion in 3-year notes on November 9, $42 billion in new 10-year notes on November 10 and $25 billion in 30-year bonds on November 12. The 10-year notes are due November 15, 2036, and the group of issues is scheduled to settle November 16. Treasury estimated that the package would refinance approximately $97 billion of privately held maturing notes and bonds and raise around $28 billion of new cash.
The 10-year offering is part of recurring federal financing, not an extraordinary debt sale triggered by the CPI data. However, it took place in a market newly sensitive to inflation and Fed tightening. That makes auction demand relevant to the additional yield investors may require to hold intermediate-duration sovereign debt. For the broader equity context, DualFinances’ November 9 Wall Street report discusses the rally that preceded the CPI reversal.
IEF Shows the Price Cost of Higher Treasury Yields
The supplied NASDAQ:IEF chart showed the iShares 7–10 Year Treasury Bond ETF around $90.91, down 0.97% during the November 10 session. IEF owns intermediate-duration Treasury securities and is not itself the auctioned note. Its price movement nevertheless illustrates the effect of higher yields on existing bond holdings. Volume was displayed on the chart, but Tuesday’s bar was incomplete at capture time.
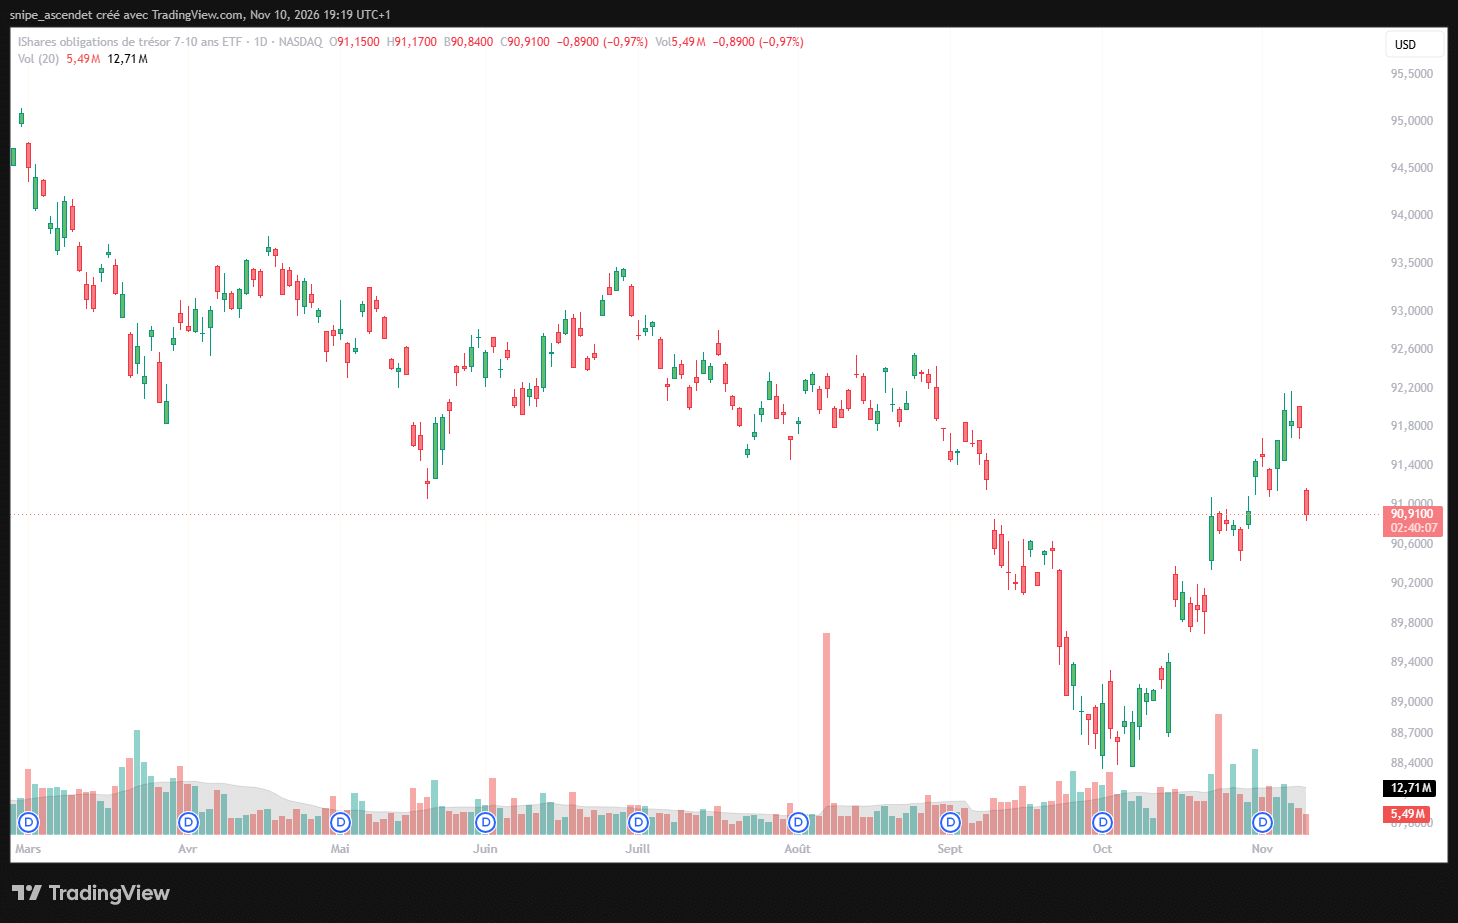
An ETF holder can experience a mark-to-market loss as bond yields rise, even though Treasury securities are backed by the United States for promised principal and interest payments when held to maturity. An ETF does not have one fixed maturity date in the same way as an individual Treasury note; it continuously manages a portfolio. A high quoted yield does not eliminate duration risk.
The 30-Year Yield Adds Another Warning
The supply test extends to the long end. In the supplied TVC:US30Y daily screenshot, the 30-year yield reached 5.371%, up about 9.6 basis points on November 10 at capture time. Long-maturity bonds generally carry greater price sensitivity to an equivalent yield move than short-maturity securities. A change in inflation expectations, term premium or long-run financing needs can push the 30-year yield even when the Fed’s next decision mainly affects the front end of the curve.
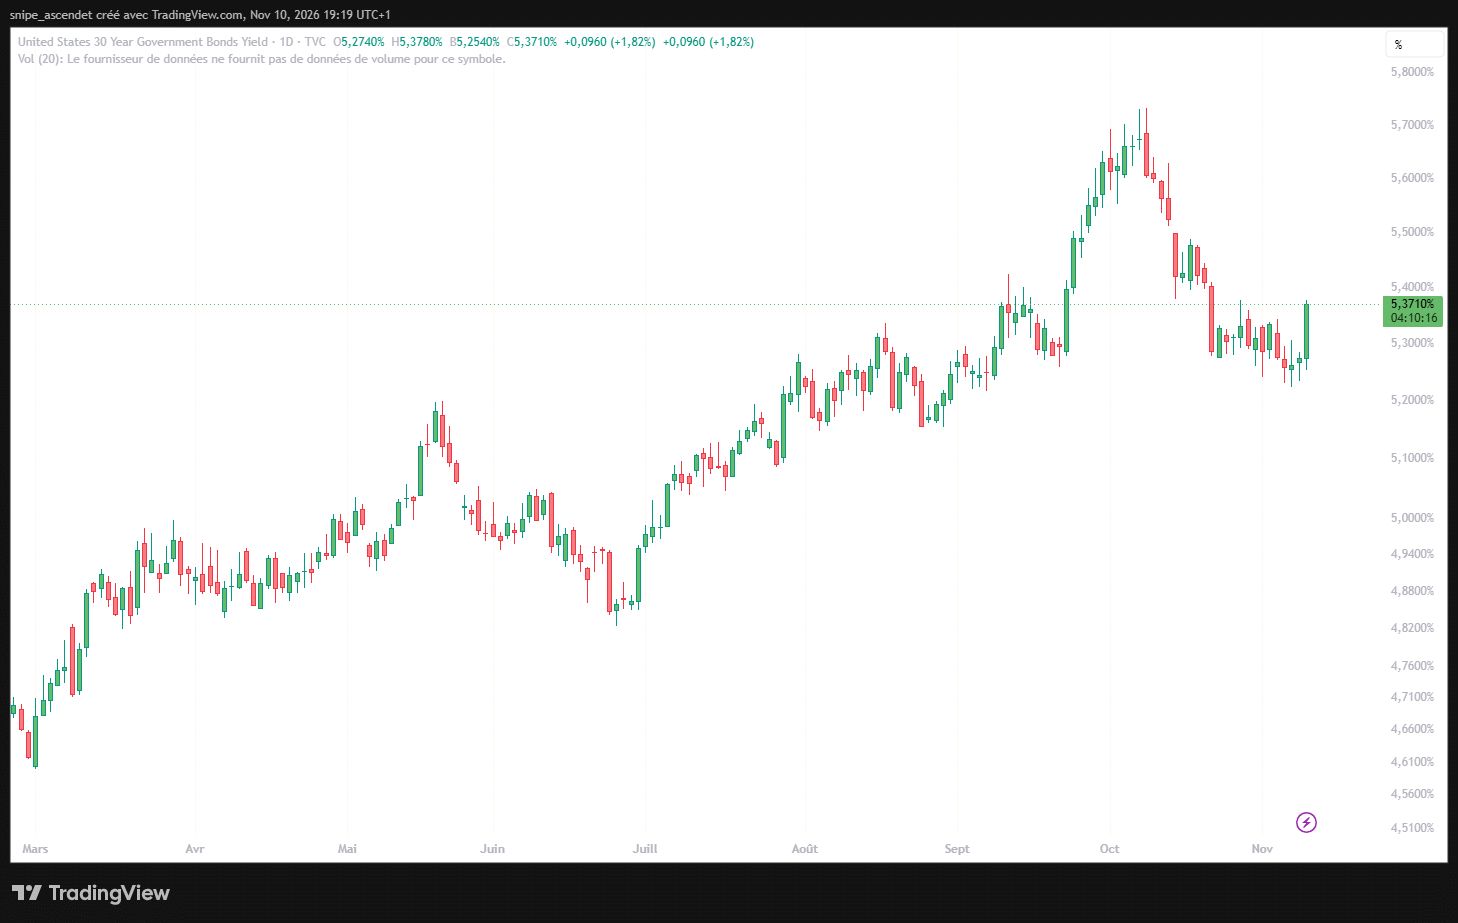
Thursday’s planned $25 billion 30-year Treasury bond auction is the next direct gauge of demand for longer-dated government debt. In addition to yields, investors will watch the cover ratio, the allotment across bidder categories and whether the issue clears above or below its when-issued yield. The broader bond-market backdrop also has an equity-market dimension: the fragile November Nasdaq rebound has faced pressure as rates rise.
What Would Signal Stronger or Weaker Demand Next?
Bull case: New buyers step in at higher yields
If inflation readings cool and auctions attract stronger demand, the 10-year yield could stabilize even while remaining elevated. A falling or negative tail alongside improving bid-to-cover and indirect participation would be more persuasive evidence of demand than a move in the yield alone.
Base case: Higher yields are needed to clear supply
Demand may remain sufficient but price-sensitive. Auctions could continue clearing with modest concessions as investors weigh inflation, deficit financing and the opportunity cost of committing capital for a decade. Under this scenario, intermediate-duration ETF prices could remain volatile.
Bear case: Inflation and supply reinforce one another
Persistent underlying inflation and higher issuance expectations could require a further increase in yields. Such a move would weigh on duration-heavy bond portfolios, mortgages and rate-sensitive equities. DualFinances’ coverage of AI infrastructure debt explains why access to financing is another channel through which Treasury-market stress can reach stocks.
The Bottom Line for Bond Investors
The reported 5.020% auction stop and 2.46 bid-to-cover ratio point to a successful but softer 10-year sale than October’s stronger reopening. The result is noteworthy because it coincided with a CPI-driven surge in Treasury yields, a decline in IEF and continuing Fed policy uncertainty. One auction cannot establish a lasting loss of confidence in US debt. The better test is whether demand improves in subsequent auctions and whether future inflation figures allow yields to settle.
Verification note: The November 10 auction details are attributed to the live third-party auction monitor Helious and should be checked against TreasuryDirect’s final public result before or after publication. TradingView prices are intraday snapshots taken about 13:19 ET and not official closing values. Related background in French: Bourse24’s US CPI and Nasdaq coverage.