


Nebius (NASDAQ: NBIS) was down nearly 15% in Thursday’s U.S. premarket trading even after reporting third-quarter 2026 revenue growth of 571%. Nvidia (NASDAQ: NVDA) was also under pressure, trading roughly 8.5% below its previous regular-session close as investors assessed reports that its board was preparing to remove CEO Jensen Huang. The simultaneous selloffs exposed two different vulnerabilities in the artificial intelligence trade: the cost of building computing capacity and uncertainty at the industry’s dominant chip supplier.
At approximately 8:15 a.m. Eastern Time on November 12, supplied TradingView screenshots showed NBIS at $131.82 and NVDA at $158.94. Against their November 11 regular-session closes of $154.69 and $173.73, respectively, those snapshots imply declines of approximately 14.8% and 8.5%. These are time-specific premarket indications, not November 12 closing returns. The broader issue is whether investors will keep financing an enormous AI infrastructure expansion when deployment delays, interest costs and governance risks create new uncertainty.
Nebius Q3 earnings: strong headline growth, weak market reaction
Nebius reported revenue of $980.8 million for the three months ended September 30, compared with $146.1 million a year earlier. It generated $465.8 million of adjusted EBITDA, reversing a $5.2 million adjusted EBITDA loss in the year-earlier quarter. Both results exceeded the indicative analyst expectations of about $908 million in sales and $353 million in adjusted EBITDA cited ahead of the release.
| Q3 2026 metric | Nebius reported | Interpretation |
|---|---|---|
| Revenue | $980.8 million | +571% year over year |
| Revenue versus $908 million estimate | +$72.8 million | About 8.0% above estimate |
| Adjusted EBITDA (non-GAAP) | $465.8 million | About 47.5% of reported revenue |
| Adjusted EBITDA versus $353 million estimate | +$112.8 million | About 32.0% above estimate |
| GAAP diluted earnings per share | -$0.13 | Loss narrowed from -$0.50 a year ago |
| GAAP loss from continuing operations | -$37.5 million | Versus -$119.6 million a year ago |
| Adjusted net income (non-GAAP) | $90.9 million | Not equivalent to GAAP profit or cash flow |
| Operating cash flow, continuing operations | -$273.0 million | Cash consumed by operations in the quarter |
| Cash purchases of property, equipment and intangibles | $7.3004 billion | Capital investment cash outflow in Q3 |
| Cash and cash equivalents, September 30 | $7.4256 billion | Excludes $1.2155 billion of restricted cash |
These figures come from Nebius’s November 12 earnings release. The consensus figures are indicative estimates, not figures certified in Nebius’s financial statements. Adjusted EBITDA and adjusted net income are management-defined non-GAAP measures that exclude specified items. Investors should not treat either as free cash flow.

Why NBIS fell despite beating estimates
The central disappointment was the timing of future revenue. Management now expects full-year 2026 revenue near the low end of its previous $3.0 billion to $3.4 billion range. According to its shareholder letter, some capacity previously expected to contribute by December will instead arrive later, pushing the company’s goal of a $7 billion annualized AI-cloud revenue pace into February 2027. That annualized rate is not the same as $7 billion in recognized annual revenue.
Another important qualification concerns revenue quality. The shareholder letter describes approximately $325 million of third-quarter revenue as non-recurring, associated with an asset-light partner model. Subtracting that amount from reported sales leaves roughly $656 million as an illustrative remainder, but it is not a standardized audited recurring-revenue figure. It does show why investors should inspect the composition of a 571% headline increase rather than extrapolate it mechanically. The shareholder-letter disclosures and run-rate definition are discussed in this November 12 breakdown.
The delayed rollout matters because data centers require upfront payments for land, power connections, buildings, GPUs and network equipment. A site that begins billing customers a few months late may still incur financing, depreciation and readiness costs during the delay. Faster revenue growth can therefore coexist with a weaker short-term cash return on invested capital.
The $7.3 billion cash-spending question
Nebius spent $7.3004 billion in the third quarter on purchases of property, equipment and intangible assets, according to its cash-flow statement. This is a quarterly cash investment measure, not a forecast for the full year. With $273 million of negative operating cash flow from continuing operations, a simplified free-cash-flow calculation is:
Illustrative quarterly FCF = operating cash flow – cash capital purchases = -$273.0 million – $7,300.4 million = -$7,573.4 million.
This calculation uses the defined cash-purchase category and is not the company’s total change in cash, which also reflects financing and other investing activities. Cash and cash equivalents of $7.43 billion at September 30 provide liquidity, but the quarter’s investment outflow alone is not a valid way to estimate how long that liquidity will last: spending is uneven, funding sources vary, and restricted cash is separately reported. The investment thesis depends on converting new capacity into billable usage and sufficient future cash flow to service the capital structure.
This is precisely the distinction between demand and returns. A cloud provider can have strong customer commitments while shareholders still face dilution, refinancing risk, higher borrowing costs or poor economics on individual projects. The result is not evidence that AI demand has disappeared. It is evidence that the cost and timing of supplying that demand matter more as valuations grow.
Nvidia’s 8% slide adds a separate governance shock
Nvidia’s selloff has a different immediate trigger. The Wall Street Journal reported on November 12 that Nvidia’s board was preparing to remove Jensen Huang following allegations concerning personal relationships. At the time of the report, the company had not announced a board decision. Allegations and possible outcomes must not be presented as proven findings or completed corporate actions.
Reuters reported that Nvidia’s leadership uncertainty dragged Nasdaq futures and several AI-linked stocks lower ahead of Thursday’s open. Nvidia is unusually important to the industry’s financing chain: its accelerators are central to the capital budgets of hyperscalers and specialized GPU-cloud operators. A higher perceived risk premium for Nvidia can affect sentiment toward suppliers, customers and investors in AI infrastructure even without an immediate change in chip shipments.

For the background and what was actually reported during the prior evening’s selloff, see DualFinances’ Nvidia leadership-risk coverage. The important analytical distinction is between company-governance uncertainty and a demonstrated deterioration in semiconductor demand. One does not automatically establish the other.
CoreWeave proves the sector is not moving in a straight line
The contrast with CoreWeave (NASDAQ: CRWV) is instructive. Its shares closed November 11 at $60.77, up 24.71% in that completed regular session, according to the supplied daily TradingView chart. CoreWeave had reported quarterly revenue of $3.661 billion, up 168% year over year, alongside substantial capital requirements and financing costs. A sharp rebound following those results does not prove that cash-flow risk has disappeared.
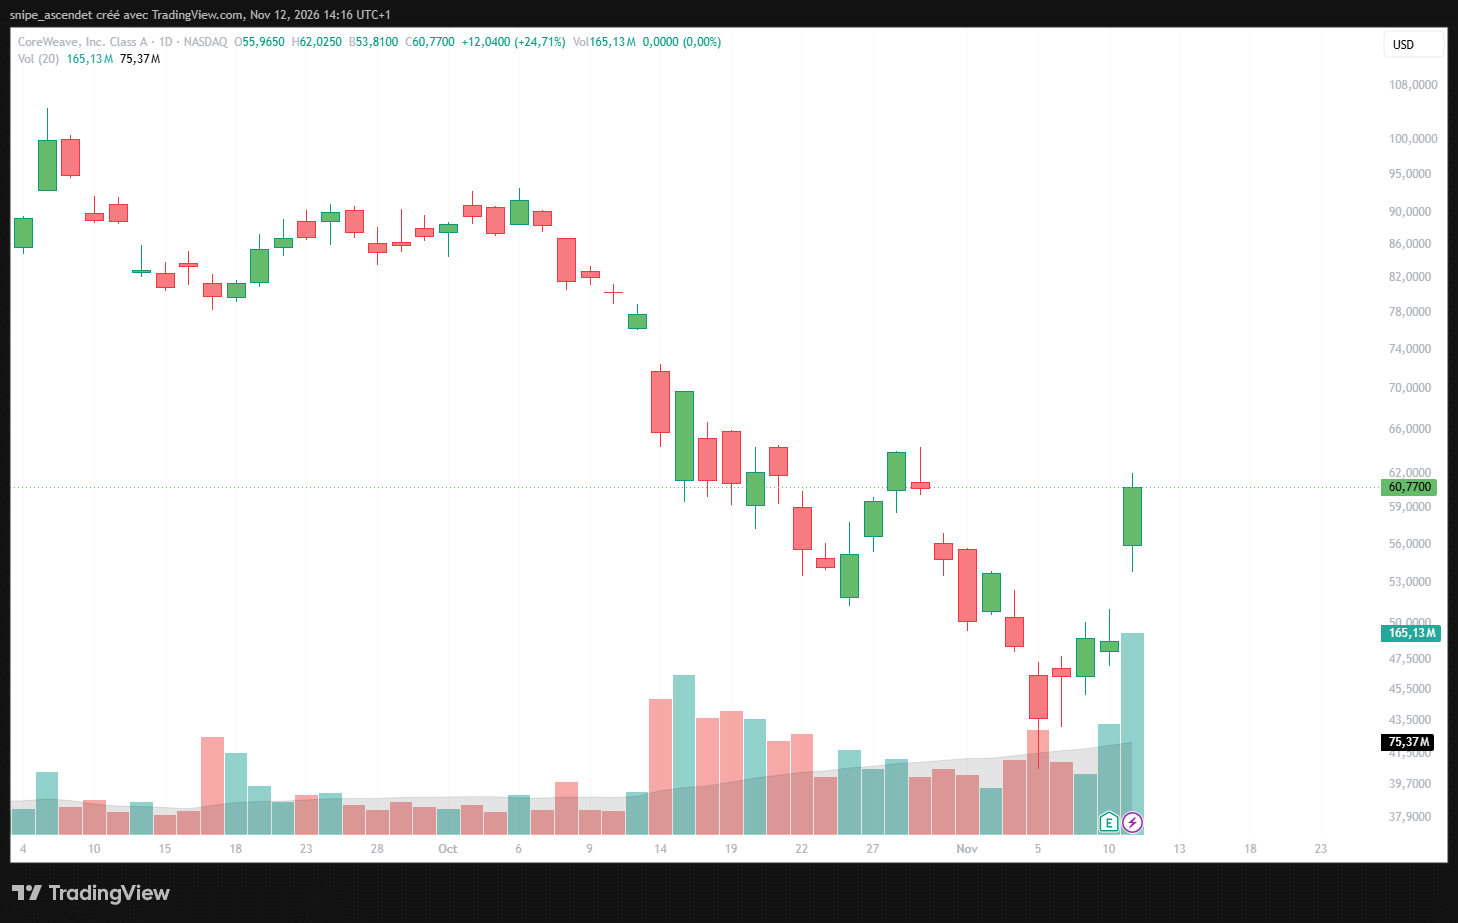
The November 11 recovery is explained in our CoreWeave and Nebius AI-stock rebound analysis. Investors seeking the financial detail can also read our CoreWeave Q3 earnings, debt and cash-flow breakdown. Those articles cover the rebound and CoreWeave’s financial disclosures; the new development on November 12 is Nebius’s own earnings and the concurrent Nvidia leadership shock.
Comparing the two neocloud operators requires consistent definitions. CoreWeave’s adjusted EBITDA, operating income, interest expense and backlog are different measures from Nebius’s adjusted EBITDA, annualized revenue pace and project spending. A comparison based only on top-line growth or a one-day stock move would miss those differences.
Nasdaq-100 and semiconductor ETFs show the wider pressure
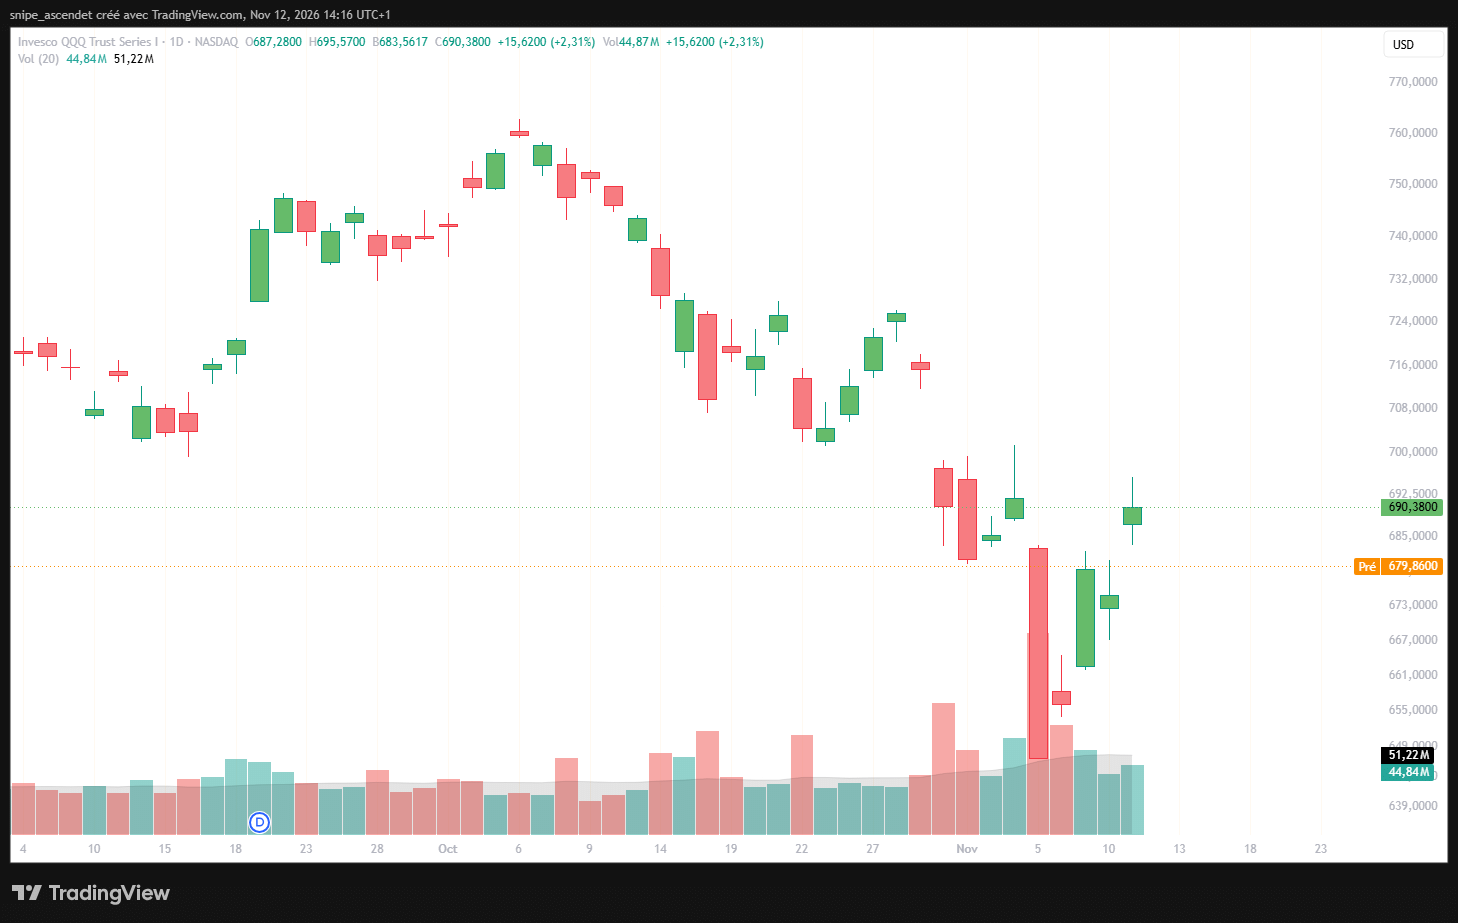
The Invesco QQQ Trust (QQQ) is an exchange-traded fund tracking the Nasdaq-100, not the Nasdaq Composite. Its daily chart shows a completed November 11 session near $690.38, followed by a displayed November 12 premarket quote near $679.86. Relative to the prior close, that premarket indication was approximately 1.5% lower. QQQ is a broad large-cap-growth benchmark, so its move is useful for assessing whether AI-stock losses spread beyond one company.
The iShares Semiconductor ETF (SOXX) showed a November 11 regular-session gain of 6.01%, closing near $155.40 on the supplied chart. Its displayed November 12 premarket quote was $150.22, roughly 3.3% below that close. SOXX covers a wider group of semiconductor businesses, not only Nvidia, and its movements should not be treated as an exact proxy for GPU orders. Its chart is split-adjusted, an important detail when comparing longer historical periods.
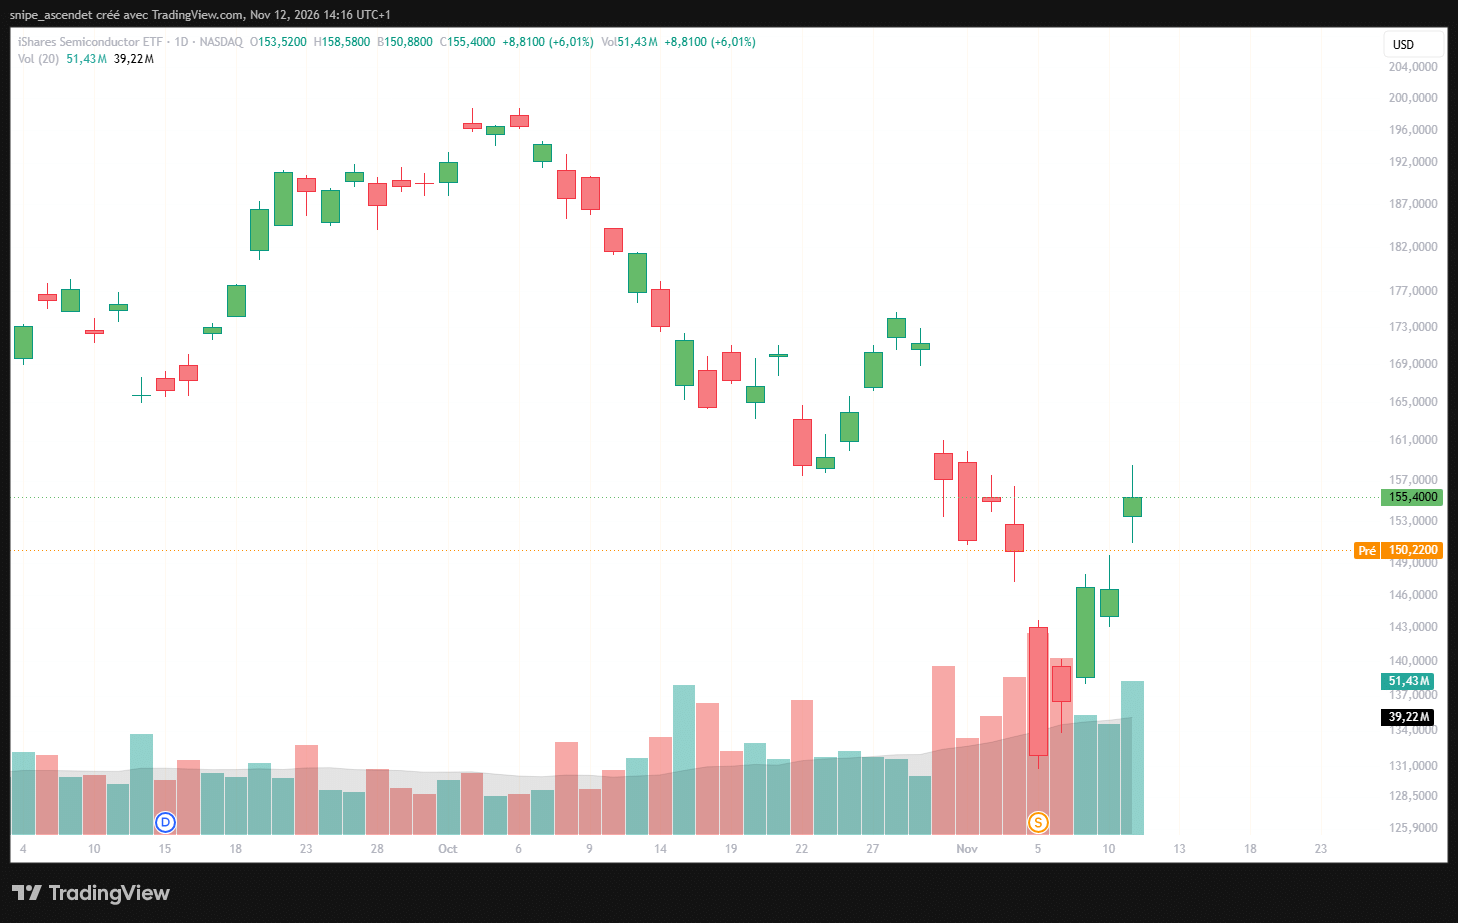
The contrast matters. Strong regular-session rebounds on Wednesday in CoreWeave and semiconductors were followed by renewed selling pressure in Thursday’s premarket. The fact that prices reversed does not identify a single cause for every stock. It does show how quickly sentiment changes when capital intensity, leadership uncertainty and valuation sensitivity converge. For a company-level comparison of chip demand, see our AMD-versus-Nvidia data-center revenue analysis.
What investors should monitor next
Three tests now matter more than an isolated premarket percentage. First, Nebius’s delivery schedule must turn contracted and planned computing capacity into recognized revenue. Management’s shifted target makes February 2027 a milestone, not a guaranteed outcome. Second, cash funding must remain adequate as data-center projects absorb billions of dollars before their full operating payoff. Debt terms, customer prepayments, restricted cash and potential share issuance deserve as much attention as adjusted margins.
Third, Nvidia’s board must clarify its leadership position. An official announcement would reduce speculation about succession, but its implications for chip supply, customer purchasing or regulation would still require separate evidence. Investors should also watch whether QQQ and SOXX recover after the regular-session opening, when liquidity and price discovery are typically deeper than in premarket trading.
Bottom line: an AI growth story is not automatically a cash-flow story
Nebius’s 571% revenue growth and EBITDA beat demonstrate a rapidly expanding business. Its delayed revenue ramp and $7.3 billion quarterly capital purchases show why faster growth does not automatically produce stronger near-term free cash flow. Nvidia’s reported leadership turmoil adds a separate shock that can influence a highly connected AI supply chain. CoreWeave’s prior-day rally and the reversal in QQQ and SOXX underline how unstable the market’s assessment remains.
The key question is not whether AI infrastructure demand exists. It is how reliably companies can deliver capacity, fund expansion and convert revenue into durable returns for shareholders. The November 12 prices above are premarket snapshots and may change materially once regular trading begins. This article is educational market analysis, not individualized investment advice.