

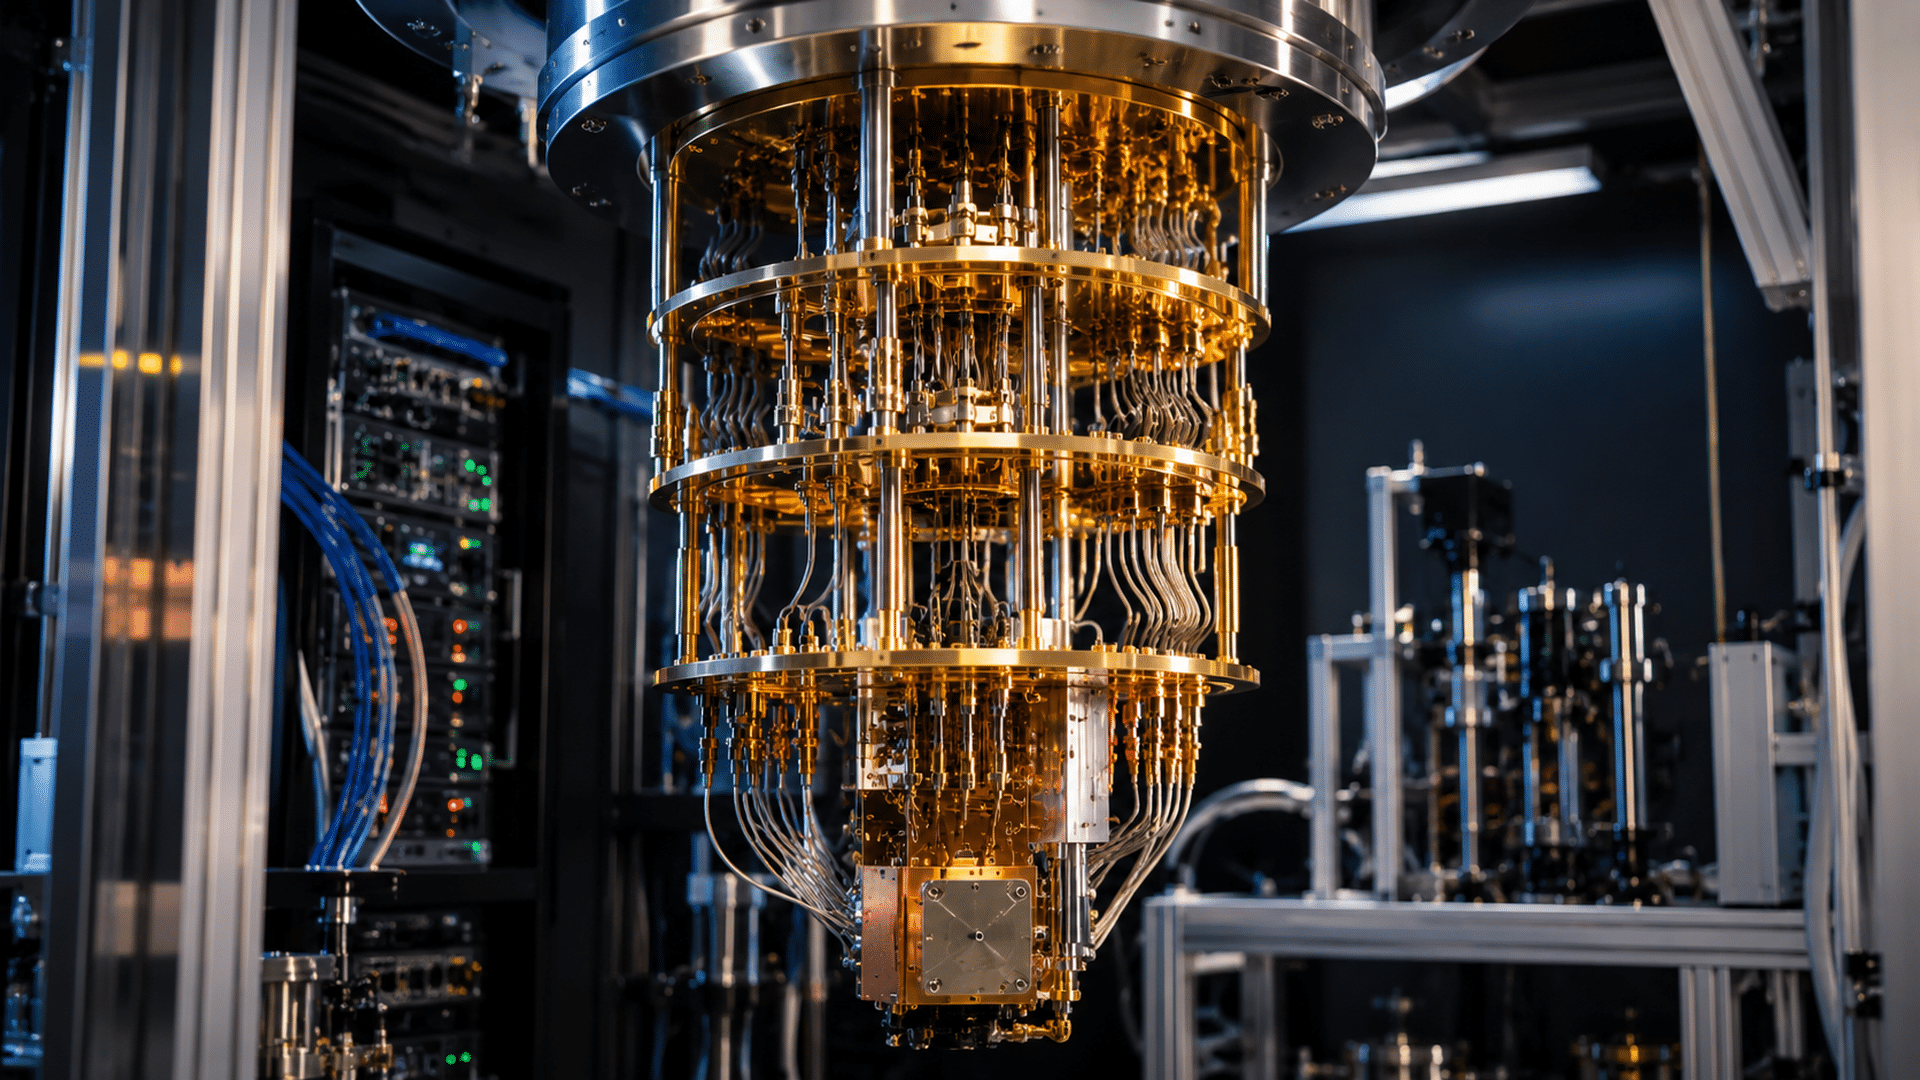
D-Wave Quantum earnings reveal a business that is winning commercial orders but has not yet converted that demand into enough revenue or cash flow to support its stock valuation on conventional fundamentals. Third-quarter 2026 revenue rose 21% year over year to $4.51 million, yet the company reported a $53.48 million operating loss. QBTS closed November 10 at $10.48, down 8.63%, putting its reported market capitalization near $3.90 billion. On a reconstructed historical sales base, investors were paying roughly 295 times trailing revenue. The stock’s long-term case therefore depends on substantial future execution, not current earnings. Sources: D-Wave Q3 release; November 10 market capitalization.
What D-Wave Actually Reported in Q3 2026
D-Wave’s November 10 earnings release covers the three months ended September 30, 2026. Dollar values below are U.S. dollars in millions, unless a percentage or per-share figure is stated. The September 30 cash balance is a point-in-time balance-sheet number, not quarterly revenue. Figures are rounded from the company’s earnings tables filed with the SEC.
| Metric | Q3 2026 | Q3 2025 or comparison |
|---|---|---|
| GAAP revenue | $4.51M | $3.74M |
| Quarterly bookings | $1.9M | About $2.3M |
| GAAP gross margin | 52.9% | 71.4% |
| GAAP operating expenses | $55.87M | $30.41M |
| GAAP operating loss | $53.48M | $27.74M |
| GAAP net loss | $48.20M | $139.99M |
| GAAP net loss per share | $0.13 loss | $0.41 loss |
| Adjusted EBITDA loss (non-GAAP) | $37.7M | About $20.6M |
| Cash and marketable securities, September 30, 2026 | $503.4M | Not a quarterly comparison |
The smaller net loss is not evidence of improving operating profitability. D-Wave explained that the year-over-year change mainly reflected a sharp reduction in noncash, nonoperating warrant-liability remeasurement charges. Its operating loss nearly doubled. Investors should start with revenue, operating margins and cash flow rather than reading the earnings-per-share improvement in isolation. For another case in which revenue growth did not prevent margin pressure, see our Hims & Hers earnings analysis.
Bookings Are Growing, but Bookings Are Not Revenue
For the first nine months of 2026, D-Wave reported $37.4 million in bookings, up 611% from the comparable 2025 period. However, bookings in the latest quarter alone fell about 19% to $1.9 million. Its disclosed bookings definition covers orders expected to produce future net revenue; the nine-month total also includes $2.3 million of Quantum Circuits orders closed just before that acquisition was completed. These differences matter when interpreting organic demand and the timing of commercial progress. Source: D-Wave Q3 release and bookings definition.
The divergence is sharper in recognized sales. Nine-month revenue fell to $10.447 million from $21.835 million, a decline of about 52.2%. The prior-year comparison benefited from large system sales, while the current period includes more services. Quarterly growth and nine-month contraction can both be true because hardware deliveries are uneven.
D-Wave also reported $38.3 million in remaining performance obligations (RPO), compared with $2.9 million a year earlier. Management expects approximately 59% of that balance, or $22.6 million, to be recognized within the following 12 months. This is a reported expectation for contracted obligations, not a guaranteed sales forecast or an addition to current-period revenue. Bookings and RPO have different definitions and should not simply be added together. For an independent example of why contracted work is not immediately recognized as sales, see our Rocket Lab backlog analysis.
D-Wave’s business spans quantum annealing systems for optimization, cloud access through quantum computing as a service (QCaaS), professional services, and an expanding gate-model research program. Management cited a second production application at NTT DOCOMO and delivery of an Advantage2 system for installation in Italy. These projects provide evidence of commercial activity, but sustainable economics require repeat orders, collections and stronger gross profit. Source: D-Wave operational update.
Why Gross Margins and Operating Expenses Matter
Revenue grew 21%, but GAAP gross profit declined to $2.39 million from $2.67 million. Gross margin fell 18.5 percentage points, to 52.9%, partly because lower-margin professional services represented a larger revenue share. D-Wave reported a 63.6% adjusted, non-GAAP gross margin, but that figure excludes certain costs and should not replace the GAAP measure. Source: SEC earnings exhibit.
At the same time, quarterly operating expenses rose roughly 84% to $55.87 million, reflecting investment in research, personnel and commercialization. Those expenditures may build future capabilities, but today’s revenue base covers only a small fraction of them. More customers or higher bookings will not automatically create profits unless recognized revenue scales faster than recurring costs.
Cash Burn: Strong Liquidity Does Not Mean Positive Free Cash Flow
The cash-flow statement reports cumulative nine-month amounts, not a standalone third-quarter cash burn figure. D-Wave used $109.025 million in operating cash during January through September 2026, versus $53.610 million in the year-earlier period. It spent another $12.957 million on property and equipment. Using a standard, simplified free cash flow definition gives:
Free cash flow = operating cash flow minus purchases of property and equipment.
2026 nine-month FCF = -$109.025M – $12.957M = -$121.982M. The comparable 2025 figure was -$55.813M. This calculation excludes the separate $252.821 million business-acquisition cash outflow, securities purchases and maturities, and spending on internal-use software. It is therefore not the total change in cash. Source: SEC cash-flow statement.
At September 30, D-Wave held $279.366 million of cash and cash equivalents plus $223.990 million of marketable investment securities, totaling approximately $503.4 million. Dividing that balance by the past nine-month average FCF outflow yields a mechanical cash-to-burn ratio of about 37 months. It is not a forecast of cash runway: future spending, acquisition costs, working capital, financing, security liquidity and contract collections can change the result substantially.
D-Wave also disclosed access to up to $100 million of U.S. CHIPS and Science Act funding, conditional on milestones and other terms. Do not treat the full conditional amount as cash already received. For a separate examination of funding requirements and cash conversion, see our AI data center financing analysis.
Calculating QBTS Valuation: What Is the Price-to-Sales Ratio?
With operating profit and free cash flow negative, a P/E ratio is not meaningful and a conventional positive-earnings multiple cannot justify the shares. One starting point is price-to-sales (P/S) = equity market capitalization / trailing twelve-month recognized revenue. Use the same dates and units for both inputs.
D-Wave reported $24.587 million of FY2025 revenue, $21.835 million for the first nine months of 2025, and $10.447 million for the first nine months of 2026. Therefore, TTM revenue through September 2026 = $24.587M – $21.835M + $10.447M = $13.199M. Sources: FY2025 earnings and Q3 2026 SEC report.
Using the approximate $3.90 billion market capitalization on November 10, 2026, P/S = $3,900M / $13.199M = approximately 295.5 times. Data vendors may show modestly different values because they use different share-count conventions or revenue updates. The calculation above explicitly identifies its inputs; it is not a forecast and does not measure enterprise value. Market-cap source.
Revenue Needed to Support the Same Market Cap at Different Sales Multiples
The following is a hypothetical sensitivity exercise, not company guidance or a price target. Hold equity market capitalization constant at $3.90 billion and calculate the annual recognized revenue that would correspond to three illustrative P/S multiples.
| Hypothetical P/S multiple | Revenue needed at $3.90B equity value | Approximate multiple of current $13.199M TTM revenue |
|---|---|---|
| 30x sales | $130M | 9.8x |
| 20x sales | $195M | 14.8x |
| 10x sales | $390M | 29.5x |
Required revenue = assumed equity market capitalization / hypothetical P/S multiple. Even the 30x scenario assumes a substantial premium for future growth and requires nearly ten times the current historical revenue. This exercise isolates the sales hurdle. It does not incorporate future dilution, debt, cash balances, margins or discount rates; those assumptions can materially change the investment case. A full valuation needs a range of future cash-flow outcomes. For a contrasting case in which the company already reports positive cash flow, see our Zeta Global earnings and valuation analysis.
What the Earnings-Day Chart Shows
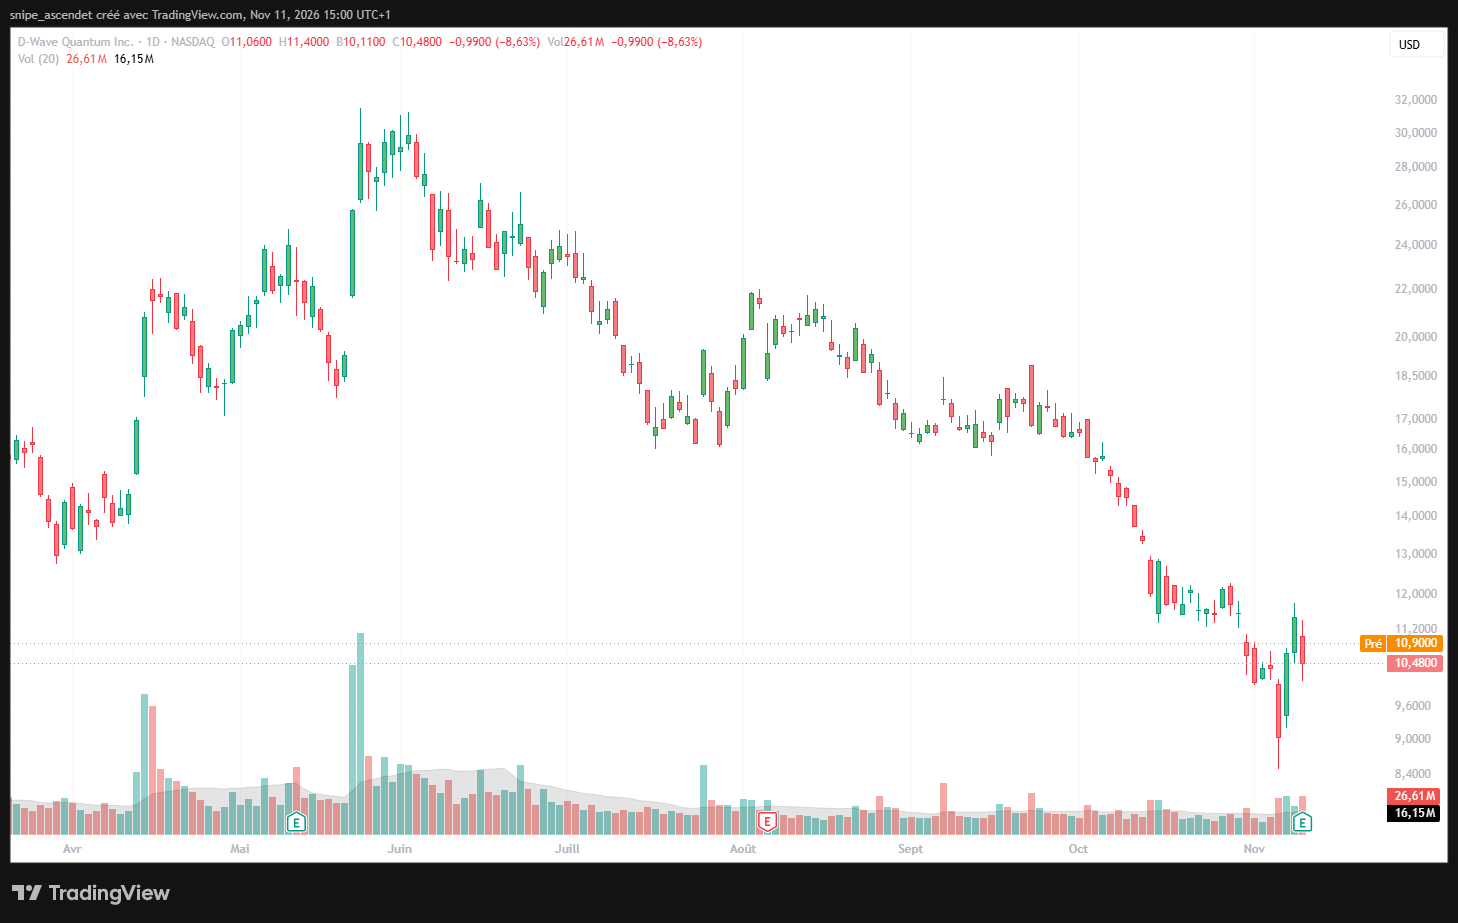
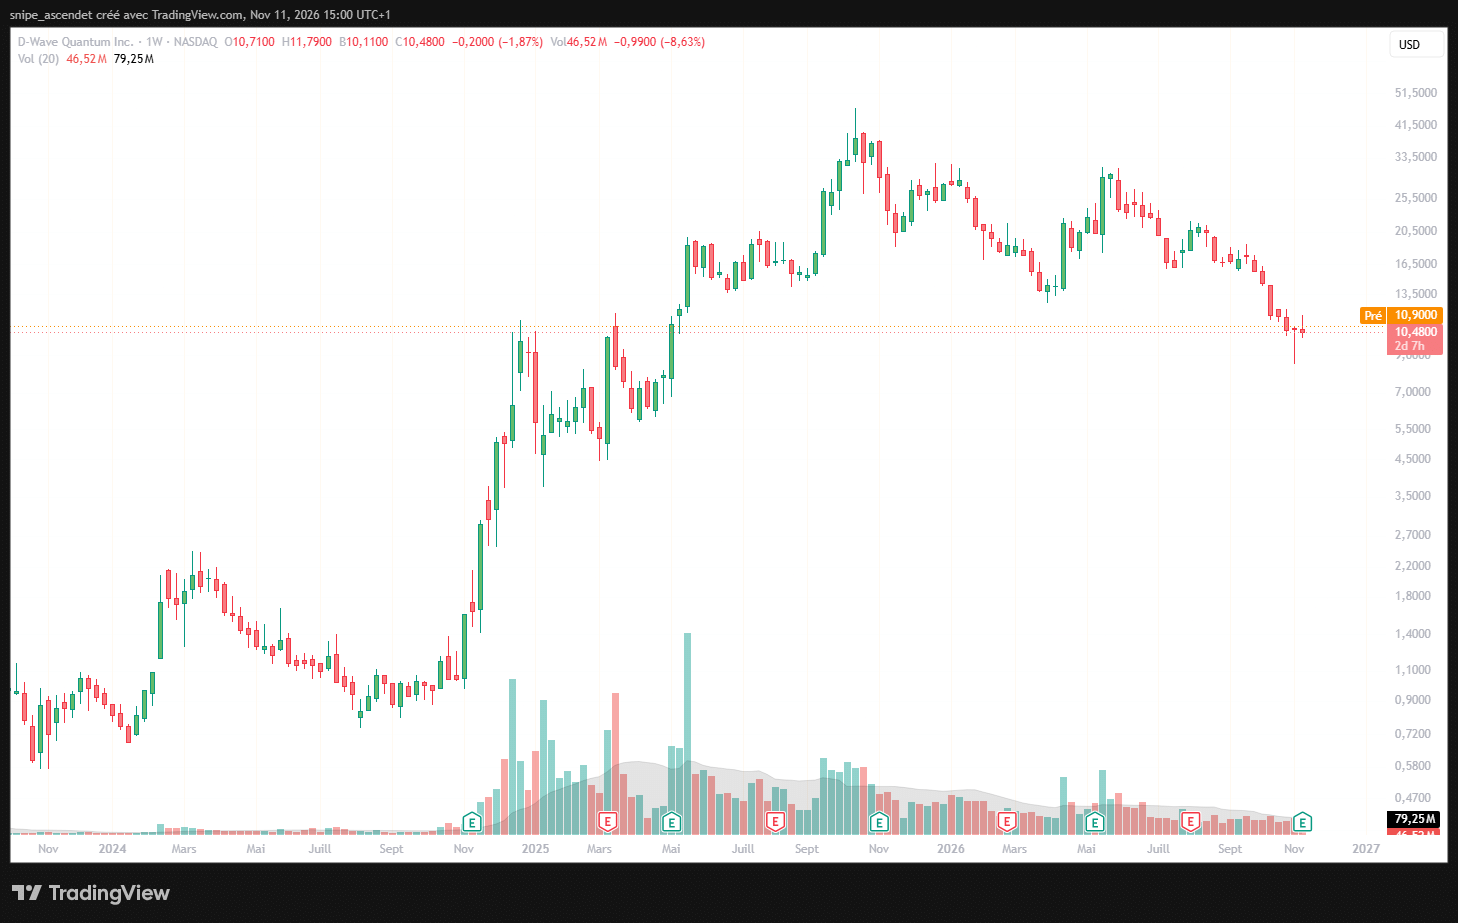
QBTS closed November 10 at $10.48, down 8.63% from $11.47 the previous day. Its session high was $11.40, low $10.11 and trading volume approximately 26.61 million shares, above the 20-session volume average displayed on the supplied daily chart (about 16.15 million). Source: historical price data.
The daily and weekly charts describe price behavior, not a fair-value estimate. Resistance and support can shift quickly when a low-revenue growth stock attracts speculative flows. The earnings-day drop is consistent with investor concern about execution, but the chart alone cannot isolate the reason for each trade.
D-Wave vs. IonQ and Rigetti: A Sector Check, Not a Fair-Value Shortcut
The supplied November 10 daily charts show IONQ at $34.99, down 0.99%, and RGTI at $12.15, down 6.39%. Both also traded lower, but the magnitudes differed. One simultaneous down session is insufficient to establish a stable correlation, a common catalyst, or relative valuation. D-Wave emphasizes annealing and hybrid optimization alongside its gate-model program; rival issuers have different hardware roadmaps, costs and customer mixes.
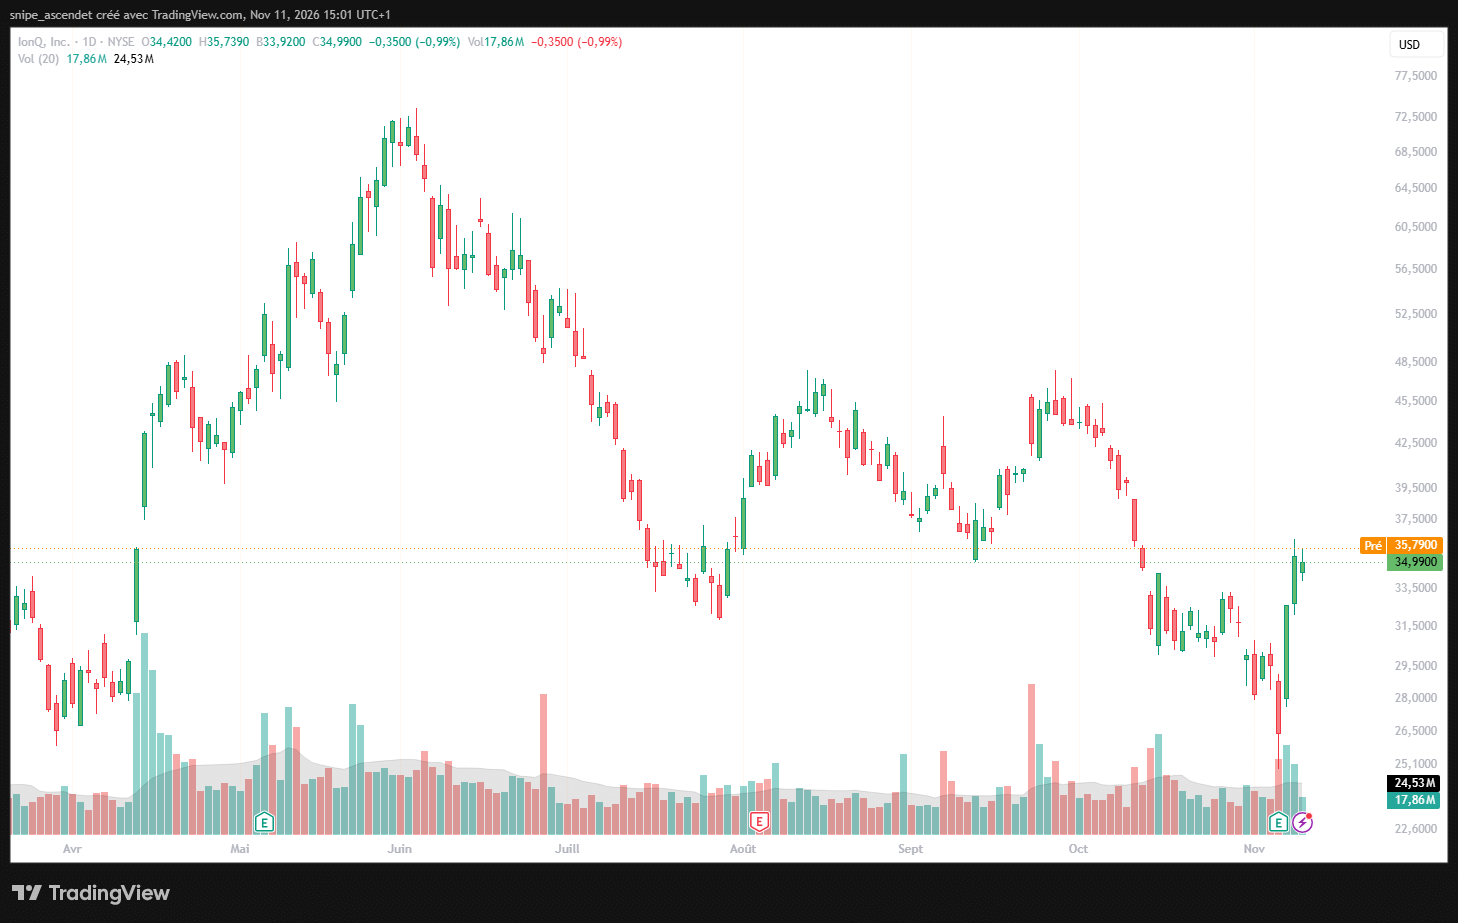
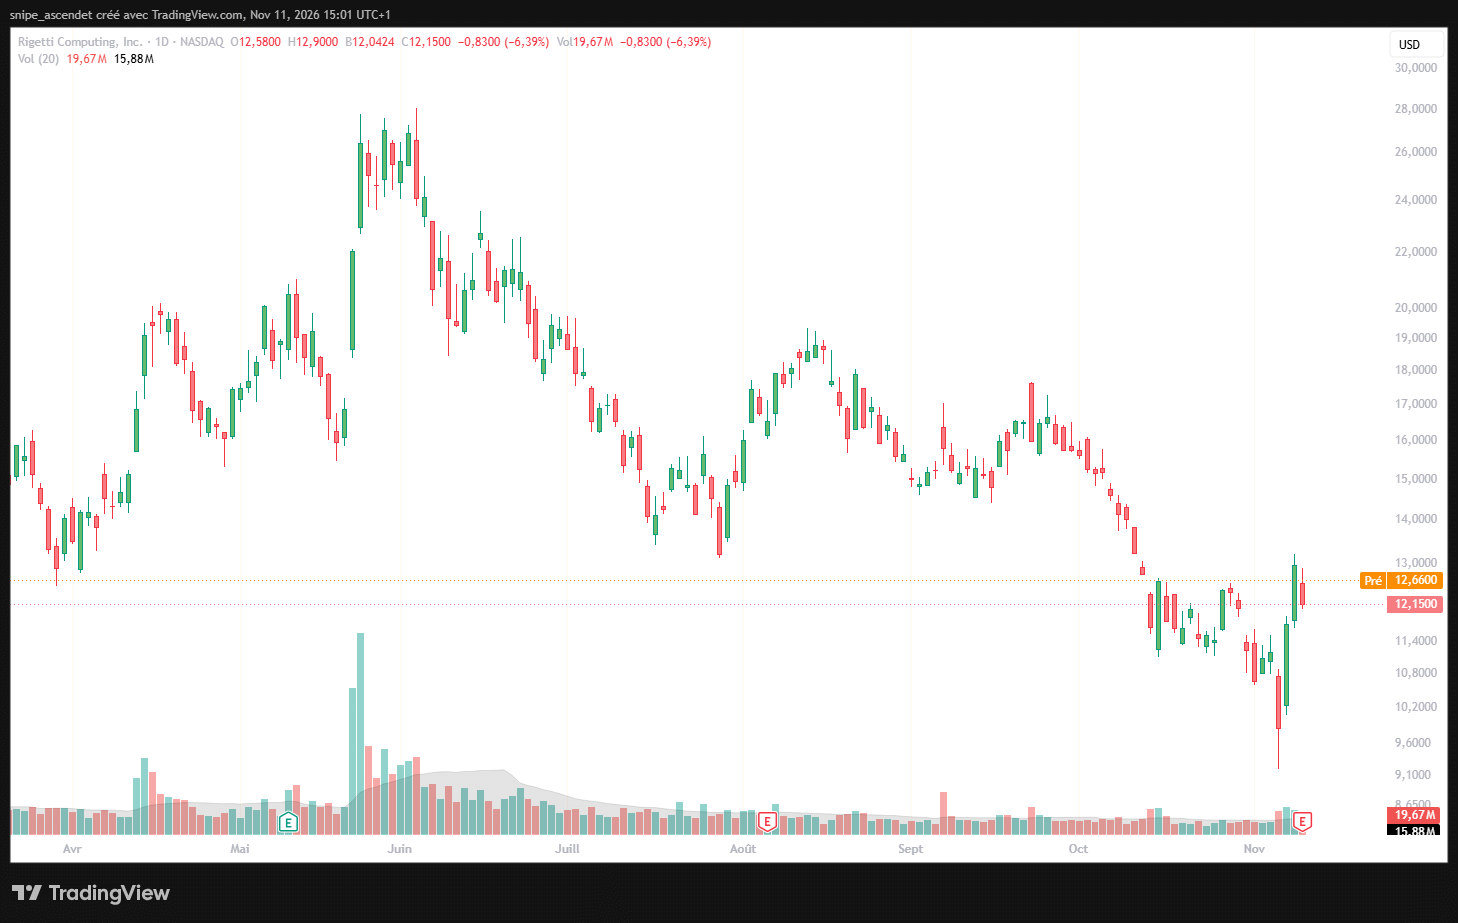
A defensible peer analysis must compare recognized sales, order quality, contract timing, technical milestones, dilution and cash requirements, not just share-price percentage changes. Compare the disclosures and business models before interpreting different companies’ headline multiples as interchangeable.
What Would Strengthen or Weaken the QBTS Investment Case?
A stronger case would require consistent conversion of RPO and bookings into recognized revenue, recurring QCaaS expansion, improved gross-margin mix, and a materially slower pace of cash consumption relative to sales. Achieving those outcomes while limiting share dilution would provide more evidence for a premium valuation.
A weaker case would involve delayed system acceptances, stagnant repeat usage, persistently high R&D spending, further gross-margin pressure, or new equity issuance before the revenue base catches up. The disclosed $29.8 million of stock-based compensation for the first nine months of 2026 also makes future share-count trends worth monitoring. These are risks and potential catalysts, not claims that specific outcomes are inevitable.
Bottom Line: Is QBTS Worth Its Valuation?
D-Wave has meaningful orders and a sizeable liquidity cushion, but its current stock valuation is difficult to substantiate using recognized revenue, operating earnings or cash generation alone. At roughly 295.5x reconstructed TTM sales as of the November 10 close, the market price embeds large expectations for future commercialization. A sound assessment should revisit revenue conversion, margin trends, cash use, share dilution and customer adoption each quarter. Quantum technology potential is real as a research and commercial field, but the investment return remains uncertain.
Educational disclosure: This article uses historical company filings and prices dated above. The revenue-multiple scenarios are hypothetical illustrations, not analyst consensus forecasts, financial advice or investment recommendations. Future performance and stock prices may differ substantially.