

CoreWeave (NASDAQ: CRWV) reported $3.661 billion of third-quarter 2026 revenue on November 10, up 168% from a year earlier and ahead of Wall Street expectations. Yet the AI cloud provider also posted a $709 million GAAP net loss, absorbed $846 million in net interest expense and is planning $37 billion to $39 billion of capital expenditures for the full year. The earnings release confirms strong demand for GPU computing, but the stock’s longer-term direction depends on whether CoreWeave can convert that demand into cash after funding its infrastructure and debt obligations. The numbers come from the company earnings release and accompanying financial statements and official third-quarter results summary.
CoreWeave’s backlog rose to $132.5 billion as of September 30, and management raised full-year sales guidance. These figures are impressive, but they must be read alongside construction schedules, operating cash flow, new borrowing and customer advance payments. The investment question is no longer simply how quickly AI cloud revenue can grow. It is how much of that growth ultimately accrues to CRWV shareholders.
CoreWeave Q3 2026 earnings: reported results versus expectations
The company delivered $121 million more revenue than the $3.54 billion FactSet consensus reported by MarketWatch. Its GAAP loss per share matched the reported consensus. Figures below refer to the three months ended September 30, 2026; dollars are US dollars.
| Metric | Reported | Expected | Difference |
|---|---|---|---|
| Revenue | $3.661B | $3.54B (FactSet) | +$121M, about +3.4% |
| GAAP diluted EPS | -$1.27 | -$1.27 (FactSet) | $0.00 |
Other key results were $207 million of GAAP operating income, a 6% operating margin, $379 million in adjusted operating income and a 10% adjusted operating margin. Adjusted EBITDA was $2.256 billion at a 62% margin. The adjusted numbers are non-GAAP measures, not net income or free cash flow. CoreWeave’s year-earlier GAAP net loss was $110 million, so the new $709 million loss is significantly larger despite the sales surge. CoreWeave published the GAAP and adjusted reconciliations with the results.
Revenue also increased from $2.575 billion in Q2 2026, a sequential gain of roughly $1.086 billion. More installed and available computing capacity is translating into sales. The question is whether future revenue can grow faster than the lifetime cost of building, financing and refreshing that capacity.
CRWV stock reaction: an earnings bounce inside a deep selloff
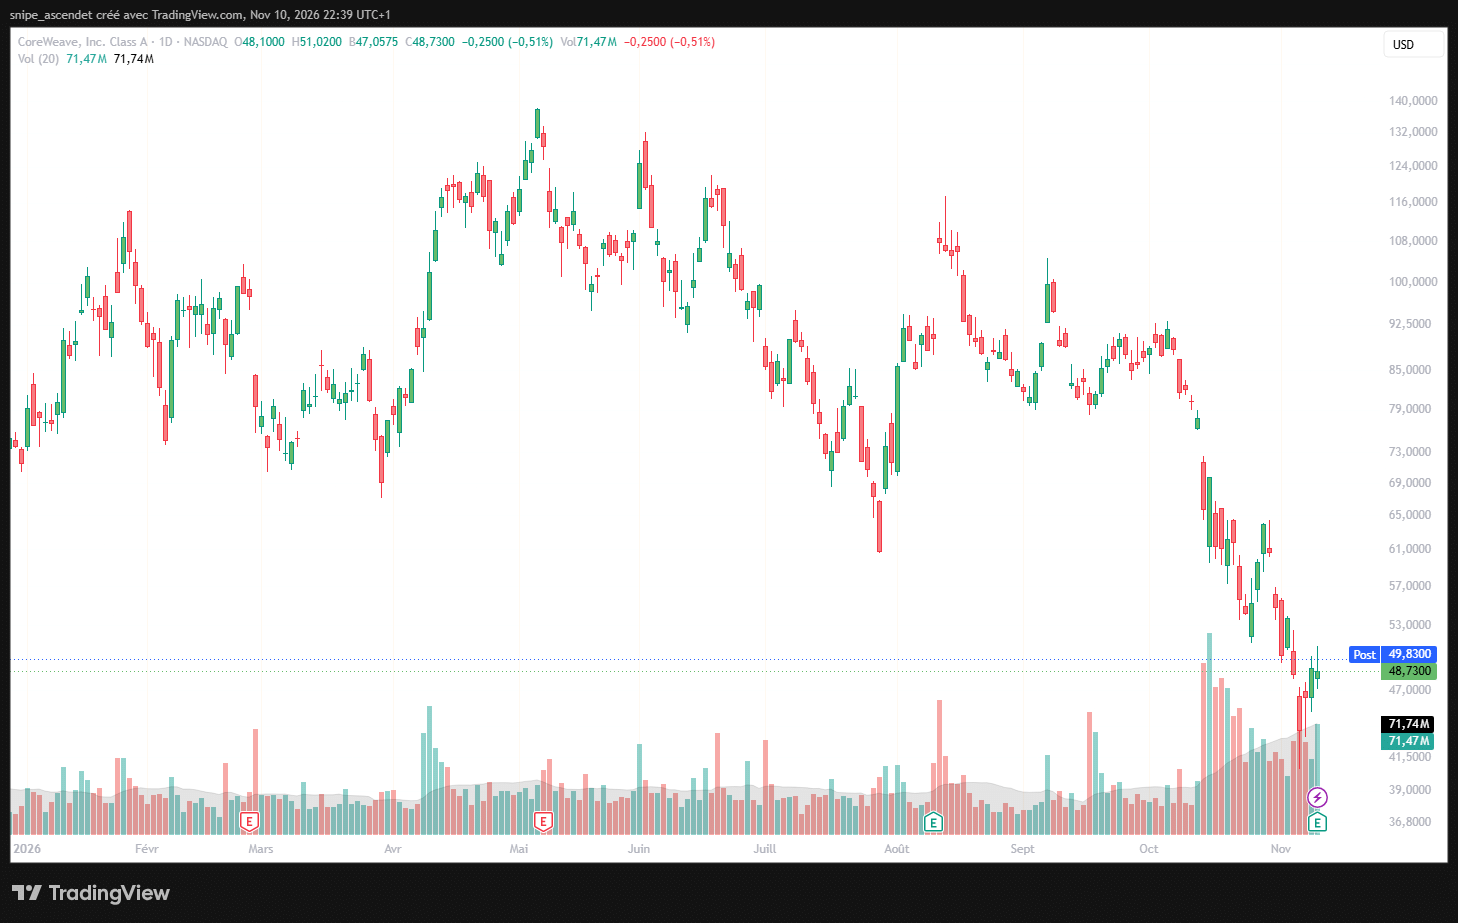
The regular Nasdaq session on November 10 ended with CoreWeave at $48.73, down 0.51%, on approximately 71.47 million shares according to the supplied TradingView daily chart. The results were released after the close. An hourly chart captured later that evening showed a $49.74 indicative after-hours price, roughly 2% above the regular-session close. It also shows a sharp initial spike and reversal. These readings are different market sessions and should not be confused with an official closing price.
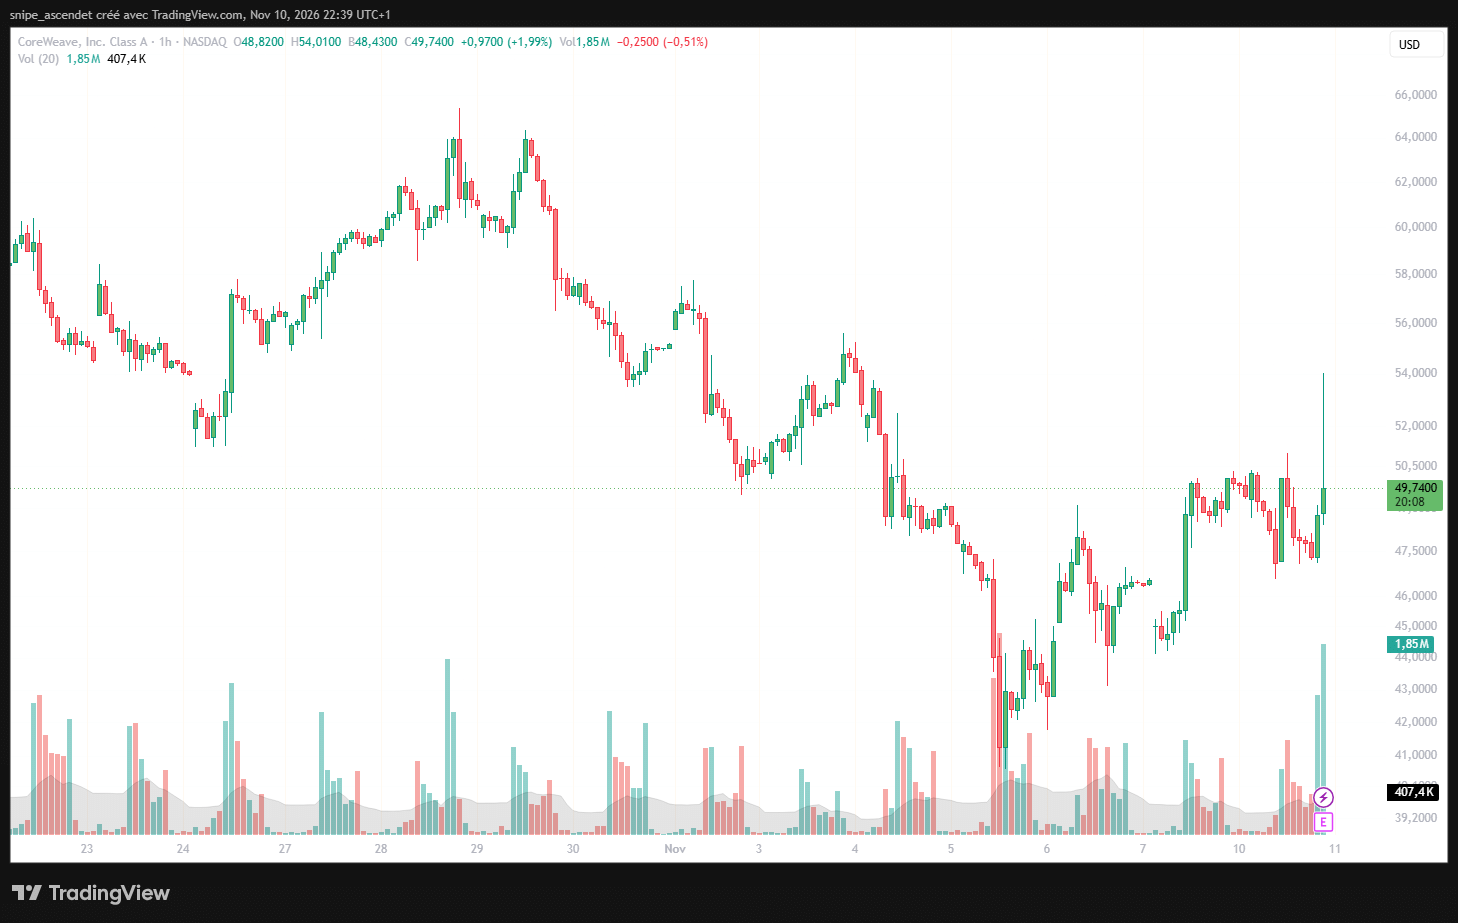
Early reports showed an initial after-hours gain of about 6%, but the first reaction moderated. One positive earnings surprise does not erase the prior decline in CRWV. The longer daily chart shows the stock well below its 2026 highs, after a series of selloffs in October and early November. A brief earnings bounce may reflect relief that revenue and margins beat expectations; it does not establish that financing risks have been resolved.
At this stage, investors can monitor whether CRWV holds the post-report recovery in the next regular session, whether volume remains elevated and whether analysts revise cash-flow assumptions rather than just revenue forecasts. A single after-hours candle is not sufficient to identify a durable reversal. The site’s earlier comparison of CoreWeave, IREN, Nebius and Applied Digital debt risks provides the sector backdrop; this report tests the latest CoreWeave earnings against that thesis.
CoreWeave’s $132.5 billion backlog is not $132.5 billion of cash
CoreWeave reported $132.5 billion of revenue backlog as of September 30, up from approximately $104.2 billion at the end of June and 138% above the year-earlier level. The approximately $28.3 billion sequential increase suggests customers continue to reserve future computing capacity. Importantly, the company defines backlog as remaining performance obligations plus certain other expected revenue under committed contracts, subject to delivery and service-availability conditions. It is not recognized revenue, cash on hand or a guarantee of profit.
The operating footprint is expanding rapidly: CoreWeave reported more than 4.6 gigawatts of contracted power, more than 1.7 gigawatts of active power and 52 active data centers in its Q3 operating summary. The gap between contracted and active power illustrates the future deployment pipeline, not spare capacity that can be monetized immediately. Construction, connections to the electricity grid, GPU availability, cooling and commissioning all influence the pace of revenue recognition.
Expanding that footprint also creates a valuation problem. New equipment can generate contracted sales over multiple years, but substantial cash must be committed before the full revenue arrives. The site’s analysis of the companies supplying electricity to AI data centers examines a separate, related bottleneck: converting rising demand for power into sustainable cash returns.
Operating profitability improved, but interest overwhelms it
The strongest earnings improvement is at the operating level. GAAP operating income reached $207 million compared with $52 million a year earlier. Adjusted operating income was $379 million, compared with $217 million in the prior-year quarter and $128 million in Q2 2026. The adjusted operating margin doubled sequentially from 5% to 10%, reaching double digits sooner than management had targeted.
That margin is nevertheless below the 16% adjusted operating margin posted in Q3 2025. More concerning for shareholders, $846 million of net interest expense exceeded GAAP operating income by approximately $639 million. The interest bill was $310 million a year earlier and $640 million in the immediately preceding quarter. Financing costs are consuming a substantial portion of the progress made in the operating business.
CoreWeave reported a $709 million GAAP net loss and a $529 million adjusted net loss for the quarter. Those figures are different because the adjusted calculation excludes specified items; neither should be treated as cash flow. The widening GAAP loss shows why rapid top-line expansion alone is not enough to validate the equity story.
Cash flow and debt: the critical test for investors
The quarter generated $1.975 billion of cash from operating activities, while cash purchases of property and equipment, including capitalized software, totaled $9.441 billion. Subtracting those two statement-of-cash-flows amounts gives a simplified negative $7.466 billion quarterly free-cash-flow proxy. This is an analytical calculation, not a company-reported free cash flow measure; it does not capture every lease-financed asset or the broader definition underlying management’s capex guidance.
Operating cash flow also benefited from a $2.127 billion increase in deferred revenue recorded in the cash-flow reconciliation. Customer payments received before service delivery help finance the business, but CoreWeave still has an obligation to provide those services. For background on the distinction, see this free cash flow methodology guide and the French-language introduction to operating and investing cash flows.
At September 30, unrestricted cash and cash equivalents were $4.122 billion, down from $5.524 billion at June 30. The reported balance sheet listed $9.183 billion of current recourse debt, $1.389 billion of current non-recourse debt, $32.417 billion of non-current recourse debt and $3.884 billion of non-current non-recourse debt. Together, these debt carrying amounts equal approximately $46.873 billion, excluding operating and finance lease liabilities. They are accounting balances, not a statement that all debt comes due immediately.
CoreWeave raised capital during the quarter and reported $7.361 billion of net financing cash inflow, versus $9.836 billion of net investing cash outflow. Management says contract-backed funding, operating cash flow and about $9 billion of customer prepayments and deposits expected over the next three months provide funding flexibility. The $9 billion is a forward-looking expectation, not cash already received. MarketWatch detailed the recent convertible-note and loan financing; Reuters reported growing lender caution toward AI infrastructure debt on November 9.
Borrowing costs are not determined solely by Treasury yields: credit spreads, collateral, covenant terms and the borrower’s financial position also matter. Readers looking for the basics can consult a French-language overview of corporate-bond credit and interest-rate risk. A separate French-language report on stress in neocloud debt markets discusses why bond pricing has become central to the AI infrastructure debate.
2026 guidance: faster deployment means more capital spending
CoreWeave raised its full-year 2026 revenue outlook to $13.0 billion to $13.3 billion and adjusted operating income outlook to $1.275 billion to $1.375 billion. It now expects 2026 capital expenditures of $37 billion to $39 billion, up from its former $35 billion to $39 billion range. Management attributed the higher spending floor to plans to deploy and deliver infrastructure sooner. Its target for exit-2026 annualized run-rate revenue is $20 billion to $21 billion, calculated using the final month’s revenue multiplied by 12; that is not full-year revenue.
The official outlook presentation also forecasts $1.05 billion to $1.15 billion of interest expense in Q4 2026. At the midpoints, projected full-year capex is nearly three times annual revenue guidance, although those two metrics are not directly comparable cash-flow statements. The imbalance captures the urgency of financing future deployments while existing assets begin generating revenue. The market must decide whether higher near-term spending is a sign of improved execution or simply a larger capital requirement.
CoreWeave versus Nebius and Nvidia: different financial exposures
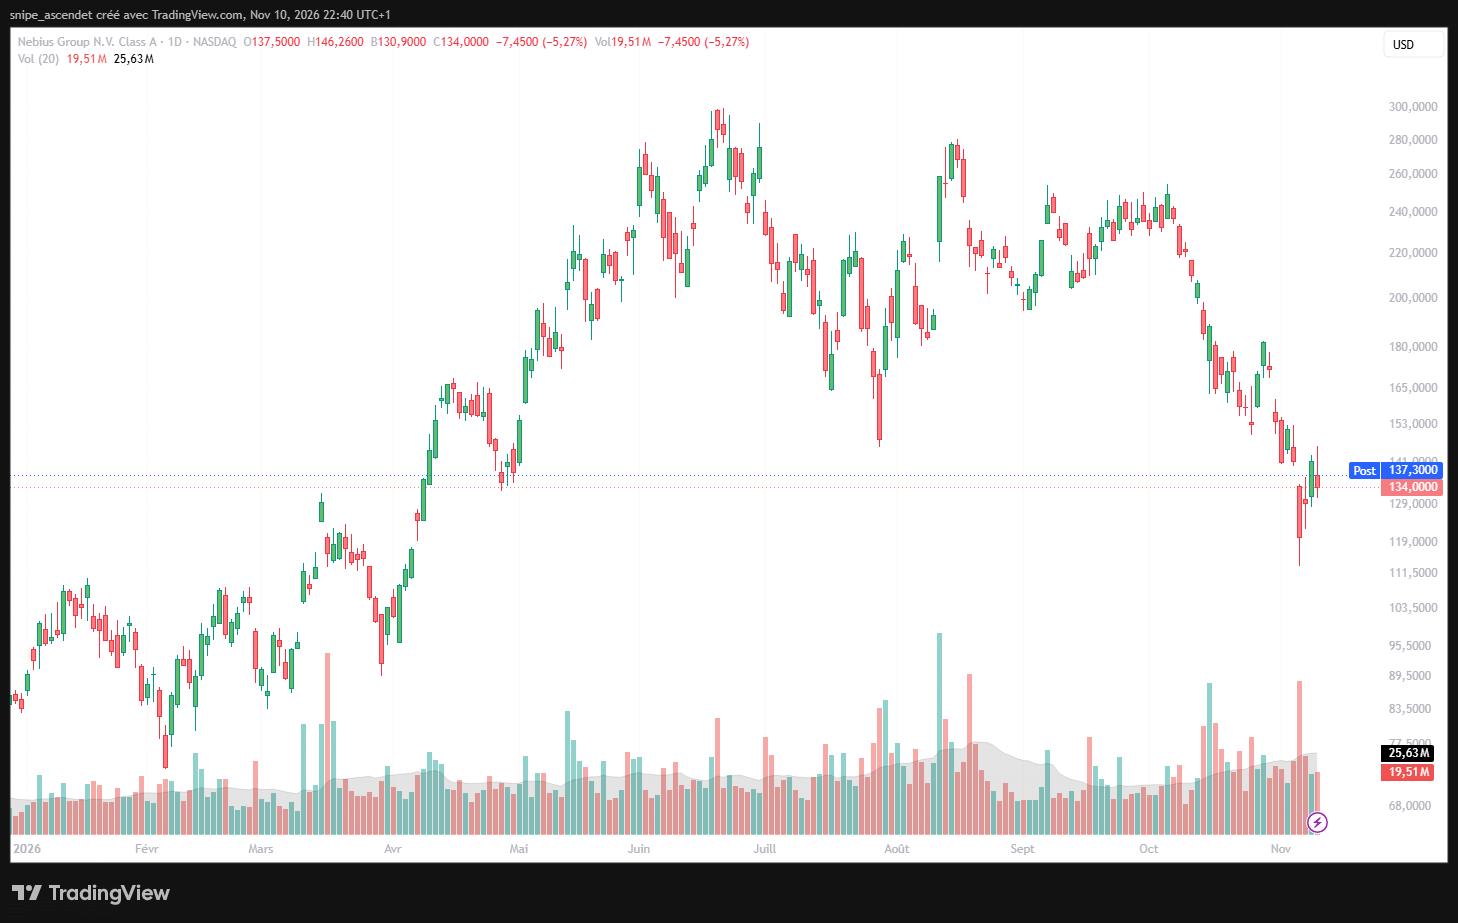
On November 10, Nebius (NASDAQ: NBIS) closed at $134.00, down 5.27%, on its supplied daily TradingView chart. Nebius is a useful strategic comparator because it is also expanding AI cloud infrastructure, although its contract mix, financing arrangements and balance-sheet profile differ from CoreWeave’s. A stronger CRWV after-hours response while NBIS fell in the regular session should not be presented as a controlled relative-performance test: the observations occur at different times.
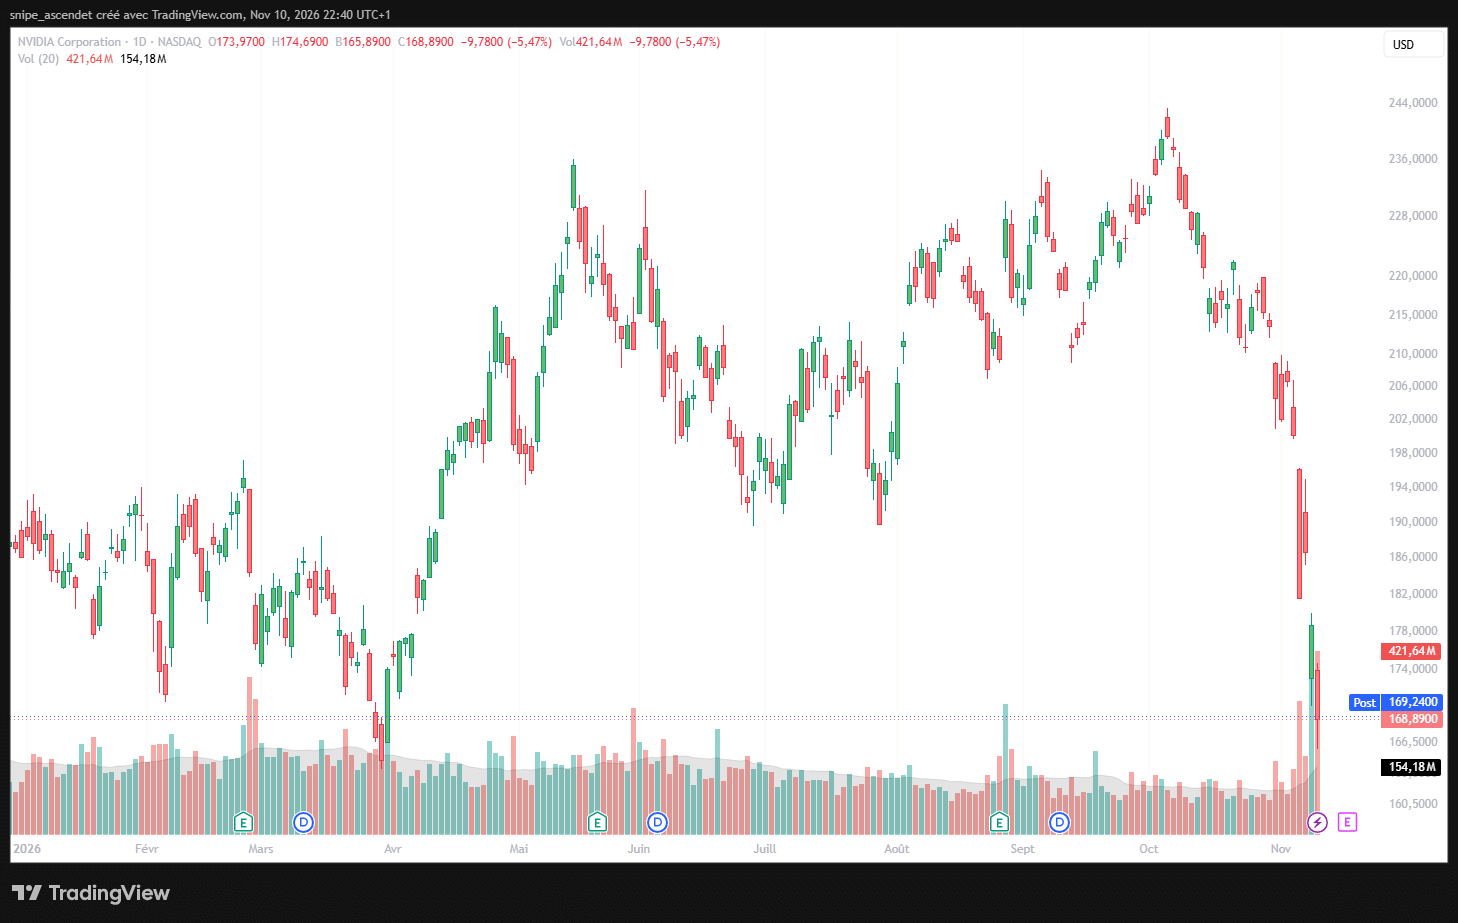
Nvidia (NASDAQ: NVDA), a critical GPU supplier to the AI industry, closed at $168.89, down 5.47% in the same regular session. Nvidia has a different business model: selling high-value hardware and software instead of primarily financing computing infrastructure to rent it out. The two stocks can react differently to the same AI spending cycle. For a supplier-side comparison, see DualFinances’ analysis of AMD’s attempt to narrow Nvidia’s data-center revenue gap.
Rising Treasury yields add pressure to the funding equation
The supplied TradingView daily chart for the US 10-year yield (TVC:US10Y) showed 5.00% on November 10, an indicated rise of 0.116 percentage points, or 11.6 basis points, versus its previous observation. That figure describes the chart provider’s indicated benchmark yield, not the actual interest rate on CoreWeave’s loans or bonds. The instrument does not include trading-volume data.
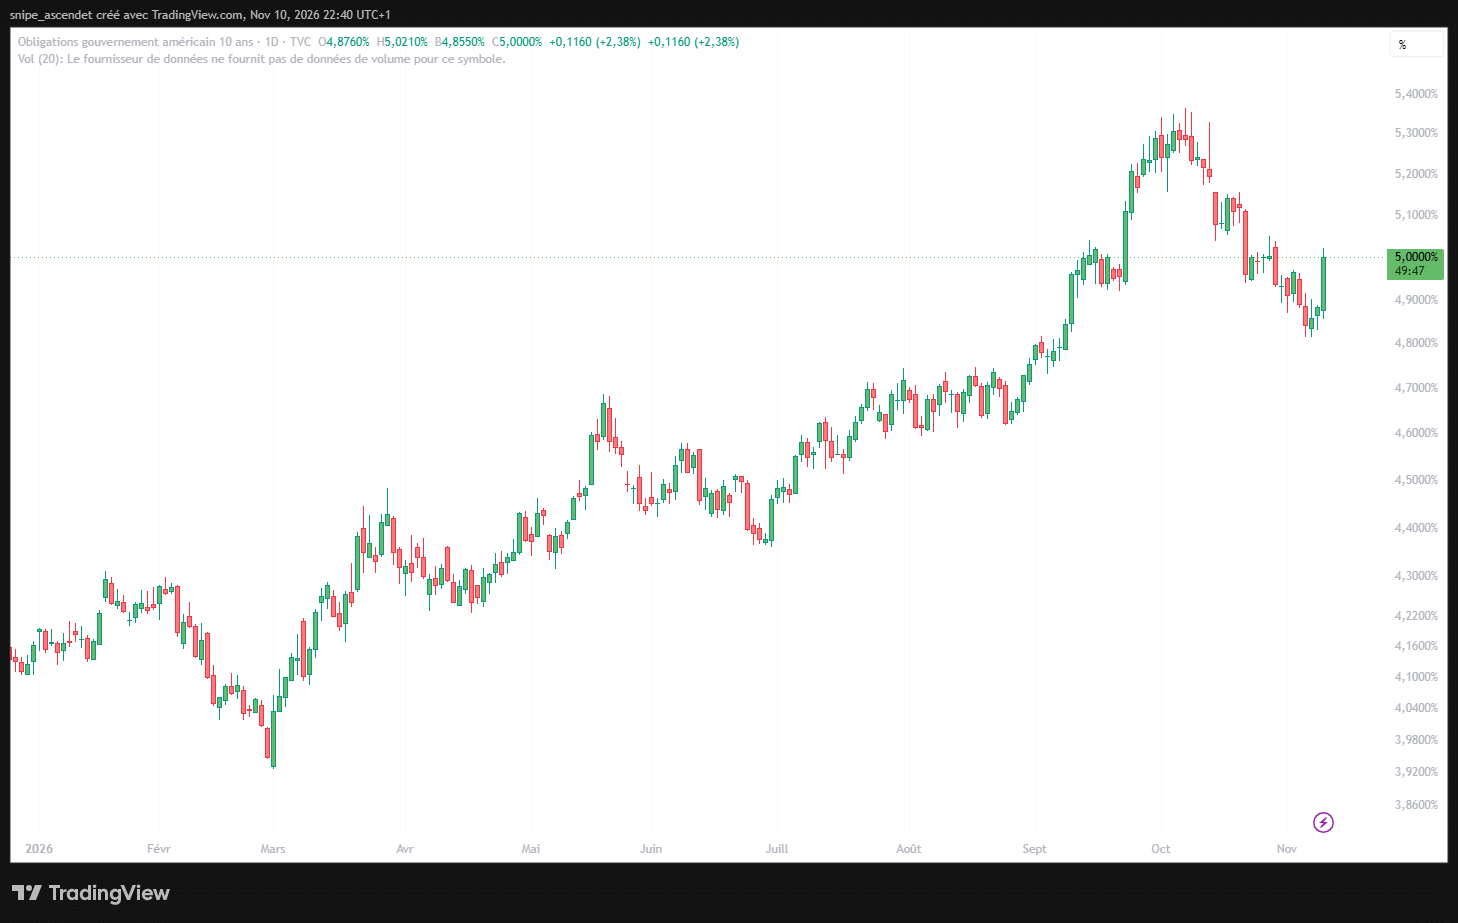
Higher risk-free yields can make growth assets less attractive on a discounted-cash-flow basis and raise the hurdle for new borrowing. For CoreWeave, the direct financing risk also depends on the spreads demanded by lenders and investors. The simultaneous moves in Treasury yields, Nvidia and AI cloud equities are informative context, but do not prove that a particular yield move caused CRWV’s price reaction.
Bull and bear cases for CRWV into 2027
What could support a recovery?
- Additional contracted power comes online on schedule and revenue recognizes under existing customer commitments.
- Adjusted operating margins expand while cash spent per incremental dollar of sales gradually falls.
- Customer-backed financing and prepayments arrive as planned, reducing dependence on expensive refinancing or share issuance.
- The company demonstrates that hardware depreciation and interest costs can be covered by a larger base of recurring operating income.
What could keep the stock under pressure?
- Equipment, power or data-center delivery delays postpone revenue but not capital or interest costs.
- Debt spreads stay elevated, forcing CoreWeave to finance growth at less favorable rates.
- Customer concentration, contract changes or lower GPU economics impair the expected return on investments.
- New equity raises could dilute shareholders, while asset and financing commitments constrain management’s flexibility.
What matters after CoreWeave’s Q3 earnings?
The next decisive disclosures are updated debt maturity schedules, financing terms, actual customer prepayment receipts, deployed capacity and the reconciliation of new revenue to operating cash flow. Investors should also track whether Q4 interest costs reach the company’s $1.05 billion to $1.15 billion forecast and whether its higher full-year investment plan produces earlier capacity delivery.
Bottom line: CoreWeave’s 168% revenue growth and $132.5 billion backlog confirm powerful demand for AI cloud capacity. But $846 million in quarterly net interest expense, a $709 million GAAP loss and a $7.466 billion simplified cash-flow shortfall after cash equipment purchases leave a central question unanswered: can the company finance its infrastructure at a cost that creates enduring value for shareholders? The earnings beat improves confidence in customer demand; it does not yet settle the debt-and-cash-flow debate.