

Updated November 11, 2026 | NASDAQ: CEG | U.S. dollars unless otherwise stated
Constellation Energy raised its 2026 adjusted earnings outlook after a strong third quarter, while long-term agreements with Amazon and Google added substance to the investment case for nuclear electricity in the AI era. The central question for investors is not whether data centers need power. It is whether Constellation can turn that demand into incremental, durable cash flow at a price that leaves shareholders an adequate margin of safety.
The answer requires separating 2026 earnings drivers from future nuclear projects. Constellation’s latest results benefited from favorable market and portfolio conditions and the addition of Calpine. Many of the most visible nuclear capacity upgrades will not begin delivering new output until later years. This distinction is essential when comparing the company’s guidance with its stock valuation.
What Did Constellation Report in Q3 2026?
According to its November 9 earnings release, Constellation reported revenue of $9.55 billion for the three months ended September 30, 2026, compared with $6.57 billion one year earlier. GAAP diluted EPS rose to $5.19 from $2.97, while adjusted non-GAAP operating EPS reached $5.06 from $3.04.
| Metric | Q3 2025 | Q3 2026 | Change |
|---|---|---|---|
| Revenue | $6.57 billion | $9.55 billion | +45.4% |
| GAAP diluted EPS | $2.97 | $5.19 | +74.7% |
| Adjusted operating EPS (non-GAAP) | $3.04 | $5.06 | +66.4% |
| Average diluted shares | 313 million | 354 million | +13.1% |
These figures are not organic nuclear growth rates. The company completed the Calpine transaction in January 2026, changing the business mix and share count. Favorable portfolio conditions also influenced earnings. The growth rate in EPS is therefore not a clean measure of how quickly existing reactors became more profitable.
Constellation increased its full-year 2026 adjusted operating EPS guidance from $11.50–$12.50 in August to $12.50–$12.80 in November. The midpoint moved from $12.00 to $12.65, an increase of 5.4%. Its new guidance is narrower, but it remains a management forecast, not realized earnings. The earlier range is documented in its August earnings release.
Why Nuclear Energy Fits the Data-Center Demand Story
AI infrastructure requires high electricity availability, but higher demand does not automatically deliver higher shareholder returns. The U.S. Energy Information Administration’s November 10, 2026 Short-Term Energy Outlook projects record U.S. power-sector generation in 2026 and further growth in 2027. It expects nuclear generation to account for approximately 18% of U.S. electricity output in both years.
Nuclear plants can provide large quantities of steady electricity, which makes existing capacity attractive to customers seeking long-term supply. Still, the value of a contract depends on its price, delivery obligations, duration, capital requirements and what revenues would have been earned without it. Investors should distinguish a power purchase agreement (PPA), which commits to the purchase of power or related attributes, from a promise to build new electricity capacity.
Amazon and Google: contracted power versus new capacity
Constellation described several arrangements in its third-quarter release:
| Agreement | Contract terms and financial significance |
|---|---|
| Amazon / Calvert Cliffs | 20-year, 690 MW PPA and related retail arrangement; supports more than $3 billion of infrastructure investment, including a 190 MW expansion expected in 2030–2032. |
| Google / nuclear uprates | 20-year PPA supporting more than $4.3 billion in investment across 11 nuclear units and approximately 890 MW of incremental capacity, beginning with an uprate expected in 2028. |
| Google / financial energy | Separate 15-year, 2,700 MW financial energy load-following agreement; it should not be treated as 2,700 MW of newly built generation. |
| Peak+ | 20-year, 270 MW arrangement tied to existing nuclear output, slated to begin in 2028. |
The incremental 190 MW plus approximately 890 MW equals about 1,080 MW of announced nuclear capacity expansion across the Amazon- and Google-linked plans. That is not the sum of all contracted megawatts, and it is not yet operating output. Confusing contracted supply with incremental generation would materially overstate the near-term AI benefit.
A conditional federal financing commitment of up to $5 billion could support nuclear uprates. However, conditional commitment is not a completed drawdown: final financing documents, construction spending, approvals and execution still matter.
What the CEG Stock Charts Actually Show
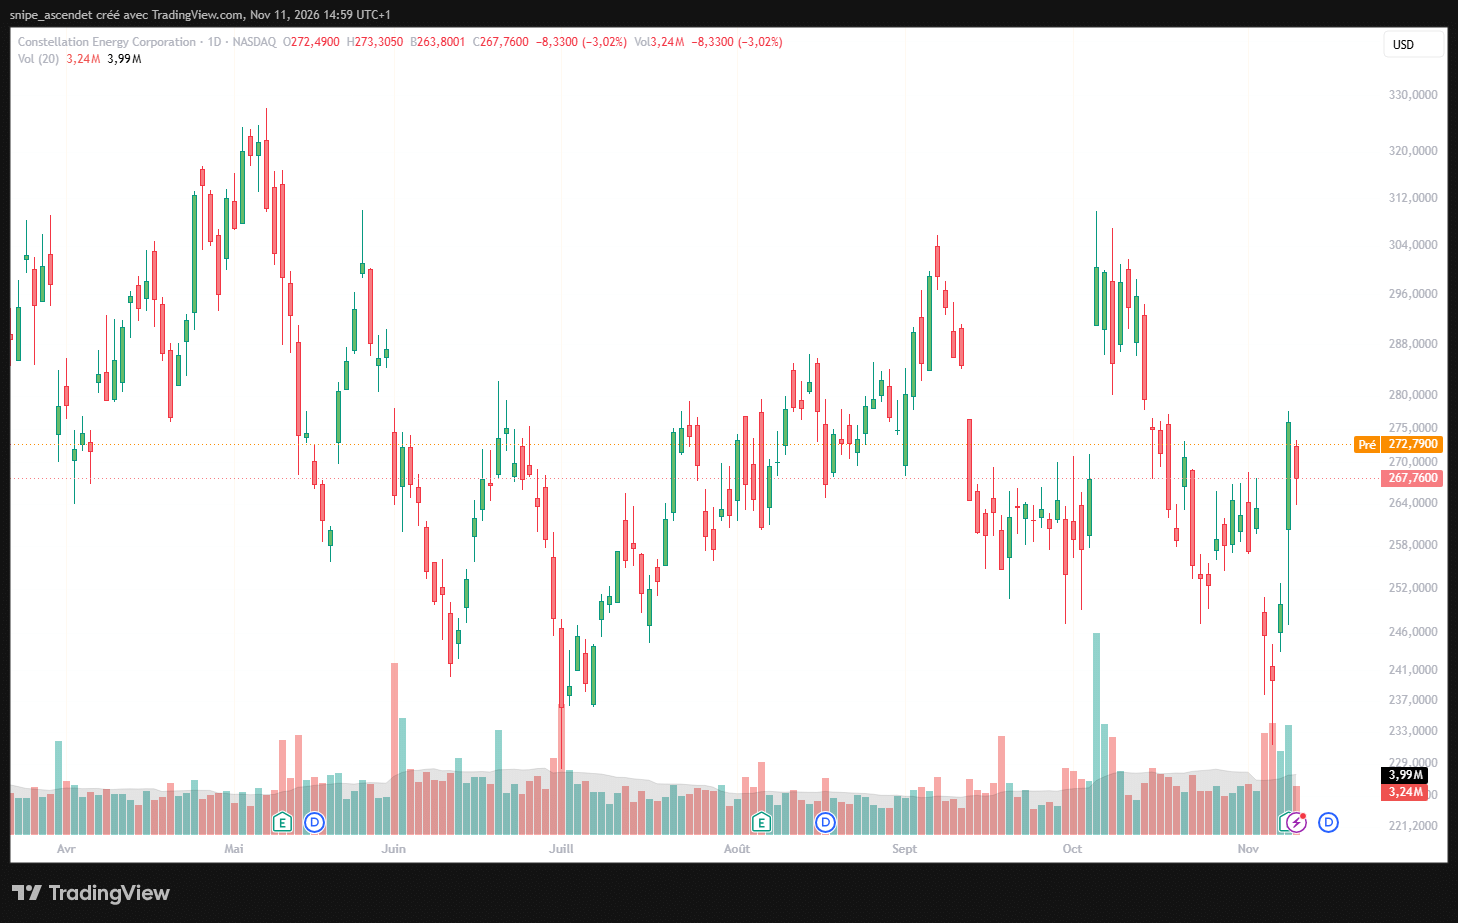
The supplied TradingView charts were captured on November 11, 2026, at 14:59 CET, before the regular U.S. stock-market open. In the daily chart, CEG’s latest displayed regular-session close is $267.76, down 3.02% for that session. A separate orange premarket indication reads approximately $272.79. Those two figures have different market-session timestamps and must not be presented as the same close.
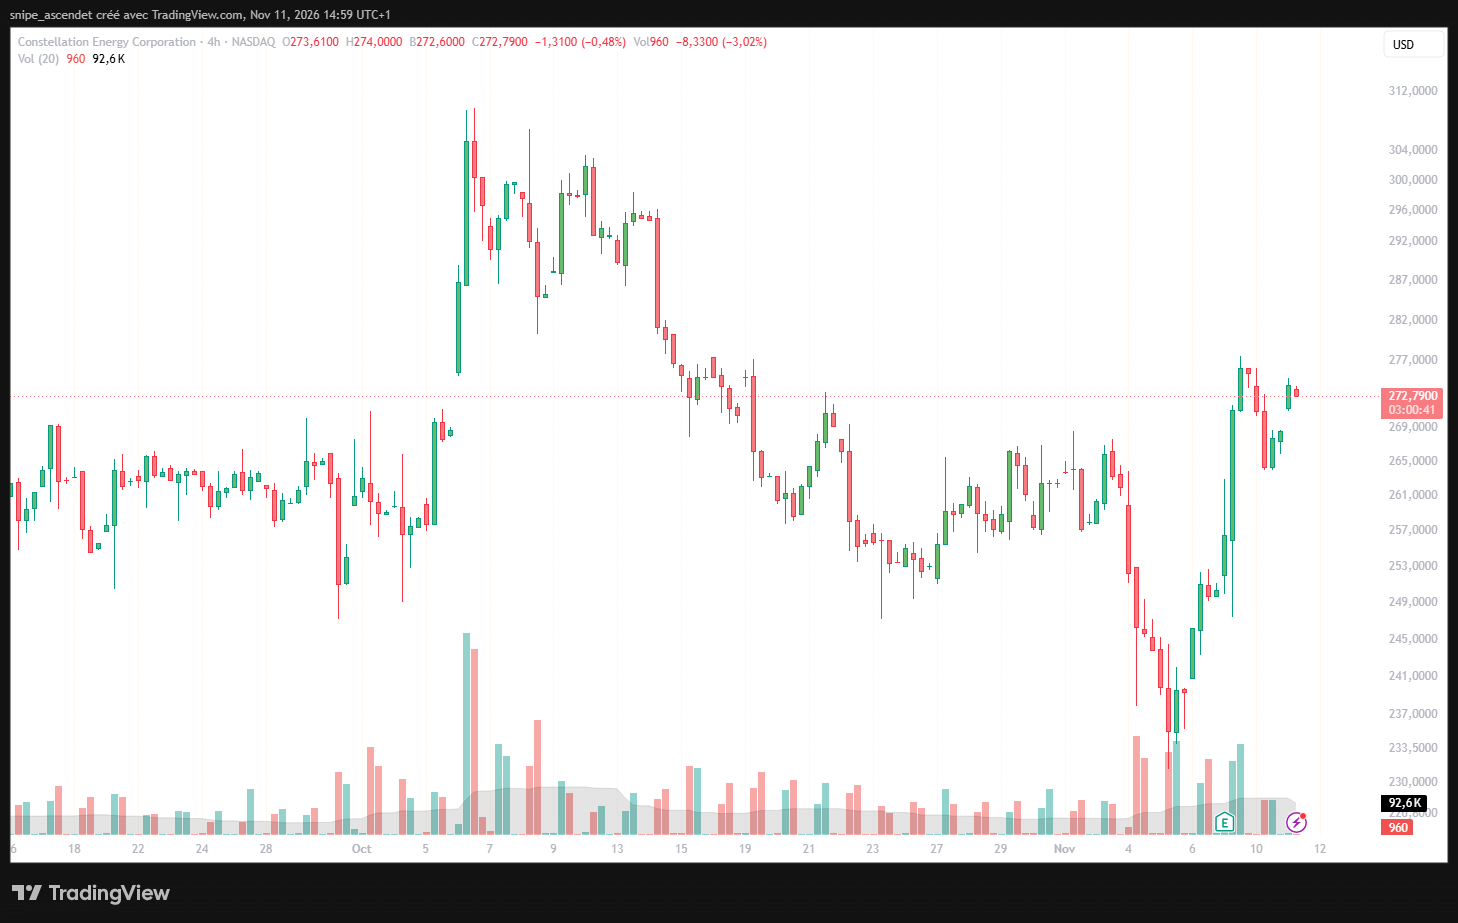
The four-hour chart captures a sharp early-November drawdown followed by a rebound around the earnings period. It does not establish that the results alone caused every price move: power stocks also face interest-rate sensitivity, sector flows and changing expectations for data-center investment.
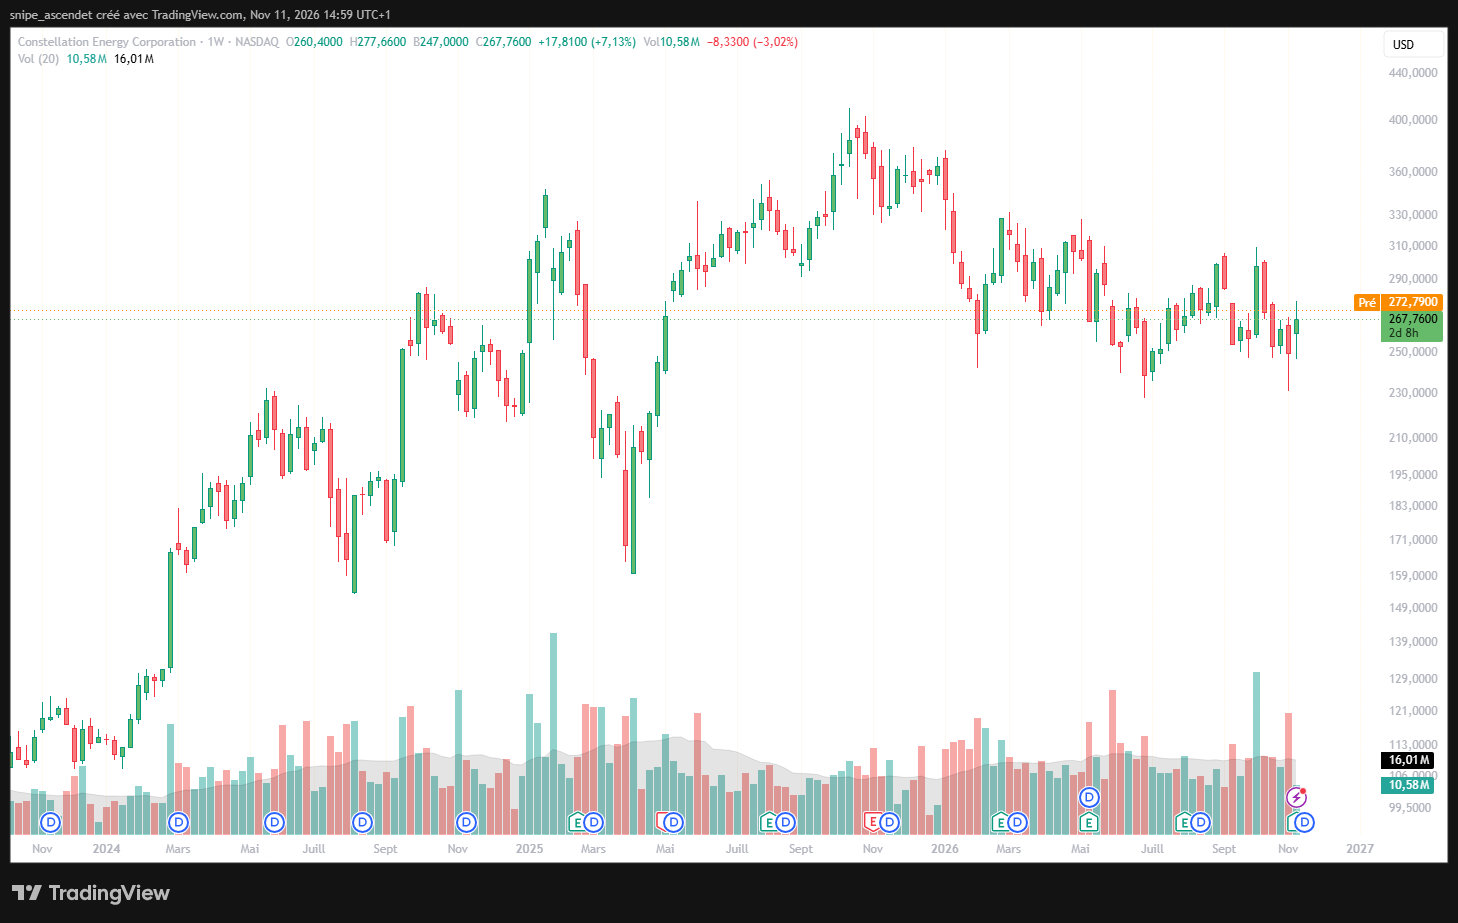
The weekly view places that volatility in context. CEG climbed substantially from its 2023 levels before retreating from peaks visible around late 2025. The latest weekly candle was incomplete when captured, so its volume should not be compared directly with full historical trading weeks.
Does CEG’s Valuation Already Reflect the AI Opportunity?
A simple earnings multiple illustrates why business growth and investment attractiveness are separate questions. Use the $267.76 daily-chart price reference, the company’s 2026 adjusted operating EPS guidance midpoint of $12.65, and the following formula:
2026 guidance-based adjusted P/E = Share price ÷ Guided adjusted EPS
$267.76 ÷ $12.65 = 21.2 times, rounded to one decimal place. Using the endpoints of the company’s range produces approximately 20.9–21.4 times. This is a 2026 management-guidance-based multiple using non-GAAP adjusted EPS, not a trailing GAAP P/E and not a 2027 analyst-consensus multiple. The $267.76 input is a dated chart reference, not a live executable quote.
At that multiple, the questions are whether 2026 performance is sustainable, whether new nuclear investments earn adequate returns, and whether the market has already capitalized much of the expected growth. For a fuller valuation, investors can build a discounted cash flow model using projected operating cash flow, investment spending and a risk-adjusted discount rate. Our analysis of financing and cash-conversion risks in AI data-center stocks illustrates why the timing of infrastructure spending and future customer payments matters.
P/E analysis has limitations for a company expanding through acquisitions and long-lived infrastructure projects. Share issuance, financing costs, depreciation, taxes and adjustments between GAAP and non-GAAP profit all affect comparability.
CEG vs. Vistra and Talen Energy: Different Ways to Own Power Demand
The Vistra chart and the supplied Talen Energy market snapshot show a sector where prices can be volatile even while long-term electricity demand grows. Vistra (NYSE: VST) has a displayed daily-session close of $131.18, down 2.05% in its latest bar, with a separate premarket indication of $135.56. The supplied Talen Energy (NASDAQ: TLN) daily snapshot showed $361.18, down 0.54%, with a separate premarket indication of $381.00. These are chart readings, not a synchronized live-price comparison.
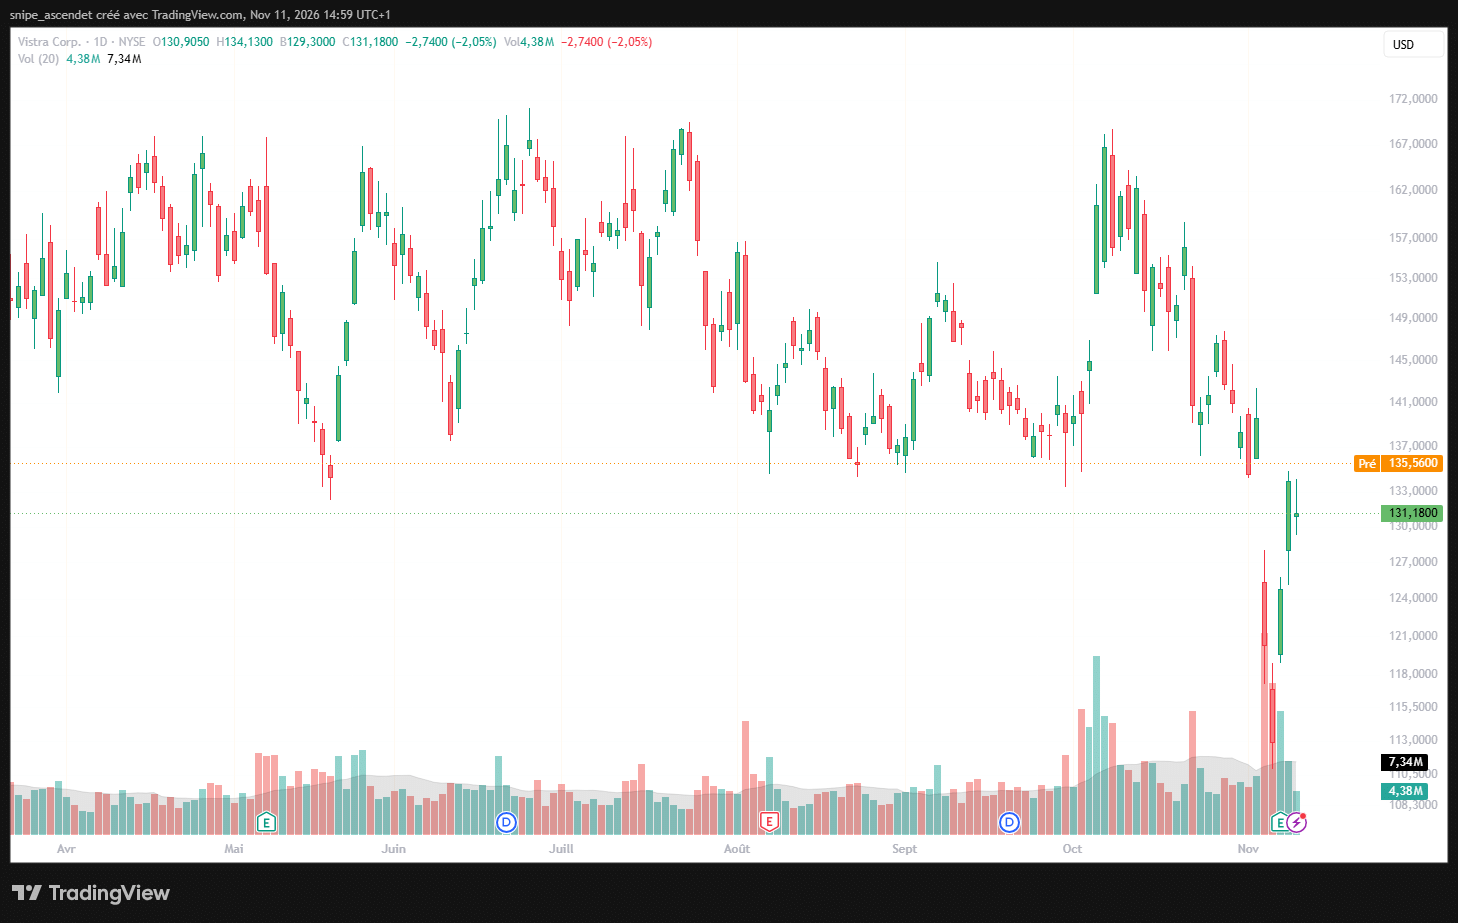
Investors should compare each company’s generation mix, merchant exposure, contract structure, leverage, investment commitments and cash-flow conversion rather than treating all three stocks as interchangeable AI proxies. Our comparison of Vistra, GE Vernova and Bloom Energy explains why power generators and equipment suppliers have different cash-flow economics.
What Could Disappoint Investors?
Three risks deserve particular attention:
- Execution and timing: nuclear uprates require engineering work, regulatory approvals and multi-year capital spending. Announced 2028–2032 timelines are forecasts, not guaranteed in-service dates.
- Earnings quality and financing: Calpine integration, commodity-market gains, higher interest costs, share count changes and other adjustments can alter the difference between reported profit and recurring cash flow. Use the company’s SEC earnings exhibit to examine the GAAP-to-adjusted reconciliation. For a separate example of why reported revenue growth and profit quality can diverge, see our Hims & Hers earnings analysis.
- Contract and market economics: higher electricity demand does not mean every additional megawatt earns the same margin. Hedging, pricing, contract counterparty quality, regulation and local grid conditions matter.
An important follow-up is free cash flow after capital expenditure, not adjusted EPS alone. Our Infineon analysis shows how capital expenditures and adjustments can separate earnings forecasts from free cash flow.
Bottom Line: Nuclear Demand Is Real, but Returns Must Be Earned
Constellation has raised its 2026 adjusted EPS guidance and entered long-duration agreements that could support additional nuclear generation as AI data centers increase electricity demand. The evidence supports a growing contracted opportunity, not the conclusion that all AI-driven capacity is already producing revenue or cash flow.
For CEG shareholders, the key indicators are delivered capacity upgrades, realized contract margins, financing costs, free cash flow and updated 2027–2029 guidance. The stock can have a credible growth story without being automatically undervalued. The most useful investment question remains: how much incremental cash will each nuclear expansion generate after the capital required to deliver it?
This article is for financial education only. It is not personalized investment advice. Market prices may change after the stated snapshot.