


Sea Limited (NYSE: SE) reported 43.4% revenue growth for the third quarter of 2026, yet investors initially sold the stock after earnings. The disconnect is not a contradiction: revenue surpassed forecasts, while per-share profit disappointed and several costs rose faster than sales. Sea owns Shopee, the e-commerce platform; Monee, its financial-services business; and Garena, its gaming division. For investors, the crucial question is whether those businesses can turn rapid expansion into sustainable earnings and cash generation.
The earnings release covers the three months ended September 30, 2026 and was published November 10. The figures below are drawn from Sea’s SEC-filed third-quarter release unless another source is identified. The trading discussion uses the completed November 10 US session, not an uncompleted November 11 session.
Sea Limited Q3 2026 Earnings: Revenue Surged, but Profit Lagged
| Metric | Q3 2025 | Q3 2026 | Year-over-year change |
|---|---|---|---|
| GAAP revenue | $5.986B | $8.582B | +43.4% |
| Gross profit | $2.599B | $3.935B | +51.4% |
| Operating income | $475.9M | $664.2M | +39.5% |
| Net income | $375.0M | $502.5M | +34.0% |
| Diluted GAAP EPS | $0.59 | $0.78 | +32.2% |
| Adjusted EBITDA (non-GAAP) | Approximately $722.5M | $931.3M | +28.9% |
| Sales and marketing expense | $1.150B | $1.887B | +64.0% |
| Provision for credit losses | $373.8M | $681.5M | +82.3% |
All amounts are in US dollars; B denotes billions and M denotes millions. Growth compares the three-month quarters, not nine-month cumulative results. Adjusted EBITDA is a company-defined non-GAAP measure and should not be substituted for net income or operating cash flow.
The clearest finding is that costs did not move uniformly. Revenue rose 43.4%, gross profit rose 51.4%, and operating income rose 39.5%. But marketing expense grew 64.0%, credit-loss provisions rose 82.3%, and net income grew only 34.0%. This is why an earnings report must be read beyond the headline growth rate. A similar tension between sales growth and profitability appears in our Hims & Hers earnings and margin analysis.
Why Did SE Stock Fall After Beating Revenue Estimates?
Sea reported GAAP diluted EPS of $0.78. A market consensus summary from Investing.com showed an expected $0.99 per share, making the reported figure $0.21, or about 21.2%, below that estimate. In contrast, approximately $8.6 billion of revenue beat a roughly $8.1 billion revenue forecast. Consensus data varies by provider and by whether earnings are adjusted or GAAP; the comparison here identifies the specific cited source rather than treating every consensus feed as interchangeable.
On November 10, Sea stock was reported down roughly 8.9% in premarket trading after the release, according to contemporaneous earnings coverage. That was not its full-day result. Sea subsequently closed at $76.80, down $1.16 or 1.49% from the previous close of $77.96, according to Sea’s investor-relations market snapshot. The difference matters: premarket moves can be volatile and should not be described as the regular-session close.
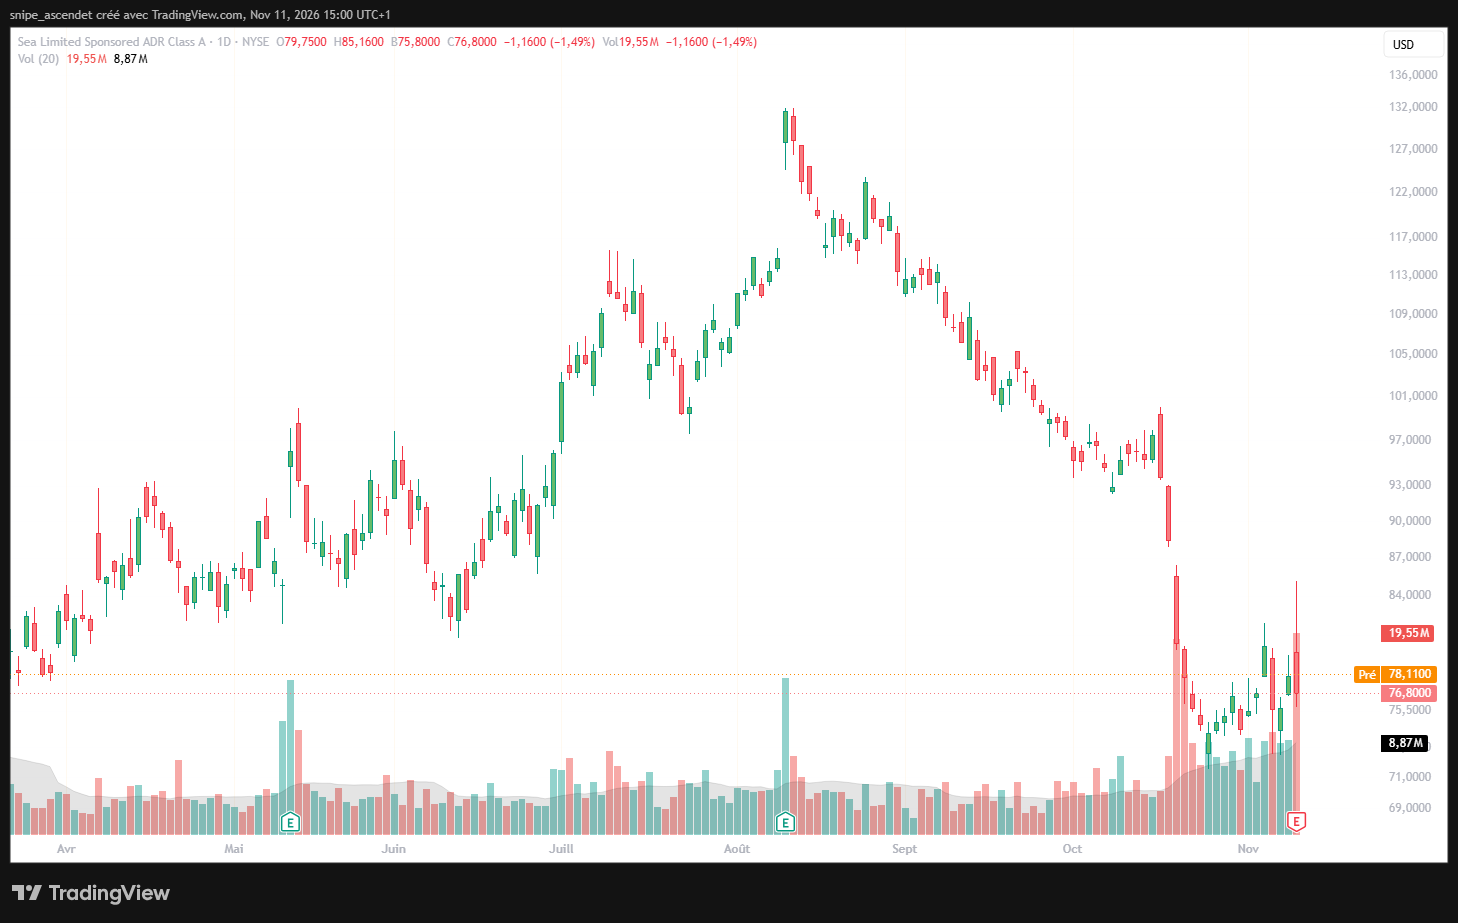
The supplied daily chart shows a November 10 high of $85.16, a low of $75.80, and trading volume of 19.55 million shares versus a displayed 20-session reference of 8.87 million. That is about 2.2 times the reference volume, consistent with an unusually active earnings session. It does not prove which investors bought or sold, or establish a single explanation for the price change.
Shopee: Stronger Monetization, but Higher Selling Costs
Shopee remained the largest contributor to Sea’s revenue. Its total GAAP revenue reached $6.07 billion, up 41.3%, while gross merchandise value (GMV), the value of merchandise traded, grew 23.3% to $39.7 billion. Gross orders increased 25.5% to 4.5 billion. Core marketplace revenue, primarily transaction fees and advertising, grew 50.6% to $4.6 billion, faster than GMV.
The gap between GMV growth and marketplace revenue growth suggests stronger monetization of transactions. However, marketplace revenue is not the same as GMV, and Shopee’s $6.07 billion of total segment revenue also includes other revenue streams. Dividing every Shopee revenue component by GMV and calling it a uniform merchant fee would misstate the business model.
Shopee delivered adjusted EBITDA of $269.2 million, up 44.7%. Dividing $269.2 million by its $6,070.2 million in revenue yields an illustrative adjusted EBITDA margin of 4.4%. This measure is positive, but it remains much lower than Garena’s margin. Shopee’s selling and marketing expense rose 60.0% to $1.43 billion, faster than the segment’s revenue. Future margin gains depend on monetization continuing to outweigh customer acquisition, promotions, fulfillment and competitive pressures.
Monee: Faster Loan Growth Raises the Cost of Risk
Monee delivered $1.62 billion in revenue, up 63.9%. Its adjusted EBITDA increased only 15.5% to $298.3 million. Credit expansion helps explain both developments: consumer and small-business loan principal outstanding reached $12.6 billion at September 30, up 60.0% from a year earlier. The total includes loans held on Sea’s balance sheet and loans originated through arrangements with other institutions.
Sea reported that loans more than 90 days past due represented 1.3% of principal outstanding, compared with 1.1% a year earlier. The increase is 0.2 percentage points, or 20 basis points. It does not by itself establish a credit crisis, but it is a material trend to monitor alongside lending growth, underwriting quality, recoveries and the economic environment.
At the consolidated level, Sea recorded $681.5 million of credit-loss provisions, 82.3% more than the prior-year quarter. Segment disclosures attribute $678.7 million of that expense to Monee. A provision is an accounting expense reflecting expected credit losses; it is not synonymous with cash loans already written off. It can nevertheless limit reported earnings even while originations and interest-related revenue expand. The challenge is to distinguish profitable lending growth from a temporary boost to revenue accompanied by worsening expected losses.
Garena: A More Profitable Counterweight
Garena revenue rose 28.6% to $840.1 million. Adjusted EBITDA climbed 45.9% to $458.2 million, while bookings increased only 5.9% to $890.0 million. Bookings and recognized revenue differ because purchases can be recognized over time under the relevant accounting rules; the quarter’s growth rates should not be treated as identical demand measures.
Garena’s strong adjusted EBITDA provides an important counterweight to Shopee’s lower percentage profitability and Monee’s credit exposure. However, a diversified business is not immune to segment-specific risks. Gaming engagement, payer conversion and the timing of deferred revenue recognition all require monitoring, especially when other divisions are spending aggressively.
The Margin Calculation Explains the Disconnect
Formula: margin = corresponding profit measure divided by revenue × 100. Using Sea’s reported quarter-only GAAP amounts, Q3 2026 operating margin equals $664.171 million ÷ $8,582.284 million × 100 = 7.74%. The comparable Q3 2025 calculation is $475.946 million ÷ $5,986.024 million × 100 = 7.95%.
| Consolidated margin | Q3 2025 | Q3 2026 | Change |
|---|---|---|---|
| Gross margin | 43.42% | 45.86% | +2.44 percentage points |
| Operating margin | 7.95% | 7.74% | −0.21 percentage points |
| Net margin | 6.26% | 5.85% | −0.41 percentage points |
| Adjusted EBITDA margin (non-GAAP) | Approximately 12.07% | 10.85% | −1.22 percentage points |
Sea improved its gross margin, meaning direct revenue costs consumed a smaller share of sales. Yet its operating, net and adjusted EBITDA margins narrowed. The mechanism is straightforward: spending below the gross-profit line, notably sales and marketing and provisions for credit losses, absorbed much of the improvement. Margin comparisons are historical observations, not forecasts of what the next quarter will produce.
Cash Flow and the New $1 Billion Buyback
The company’s financial statements also require careful treatment of cash. For the first nine months of 2026, not Q3 alone, operating activities generated $4.065 billion of cash versus $3.548 billion in the first nine months of 2025. Investing cash outflow totaled $5.629 billion, driven primarily by a $4.446 billion increase in loans receivable and $1.042 billion in property-and-equipment purchases. It would be misleading to classify all investing outflows as ordinary capital expenditure.
At September 30, Sea reported $2.905 billion in unrestricted cash and cash equivalents and $2.279 billion in restricted cash. Restricted amounts should not automatically be treated as available to fund buybacks or operating spending. Analysts should also examine funding for Monee’s loan portfolio rather than using a simple industrial-company free-cash-flow rule without adjustments. For a different example of why revenue growth must be analyzed alongside financing needs and cash flow, see our CoreWeave Q3 earnings analysis.
Sea said it had repurchased 11.1 million shares for $997.2 million under a prior $1.0 billion program, and approved an additional $1.0 billion authorization on November 9, 2026. The new authorization has no expiration, and management retains discretion over execution. A buyback can support per-share economics if funded sustainably and purchased at attractive prices; authorization alone does not guarantee purchases or higher future stock returns.
What the Daily, Weekly and Four-Hour Charts Show
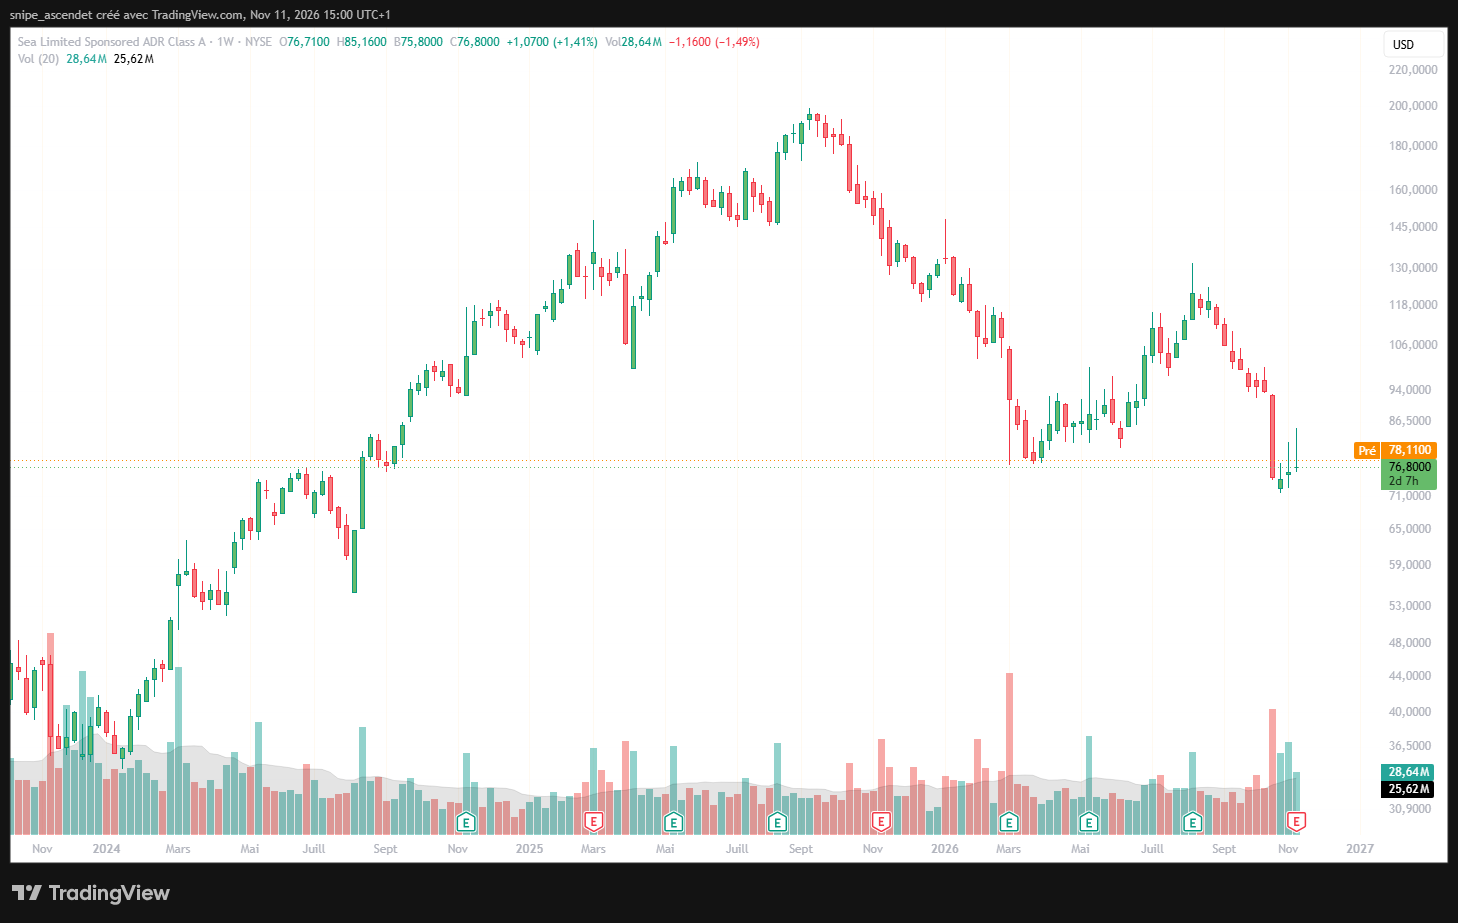
The weekly chart puts the latest reaction in perspective. SE traded near $190–$200 in late 2025 on the displayed chart, then moved through a series of lower peaks into late 2026. Around $76.80 at the November 10 close, the stock was far below its earlier high. This is a description of chart structure, not a claim that historical prices alone determine intrinsic value.
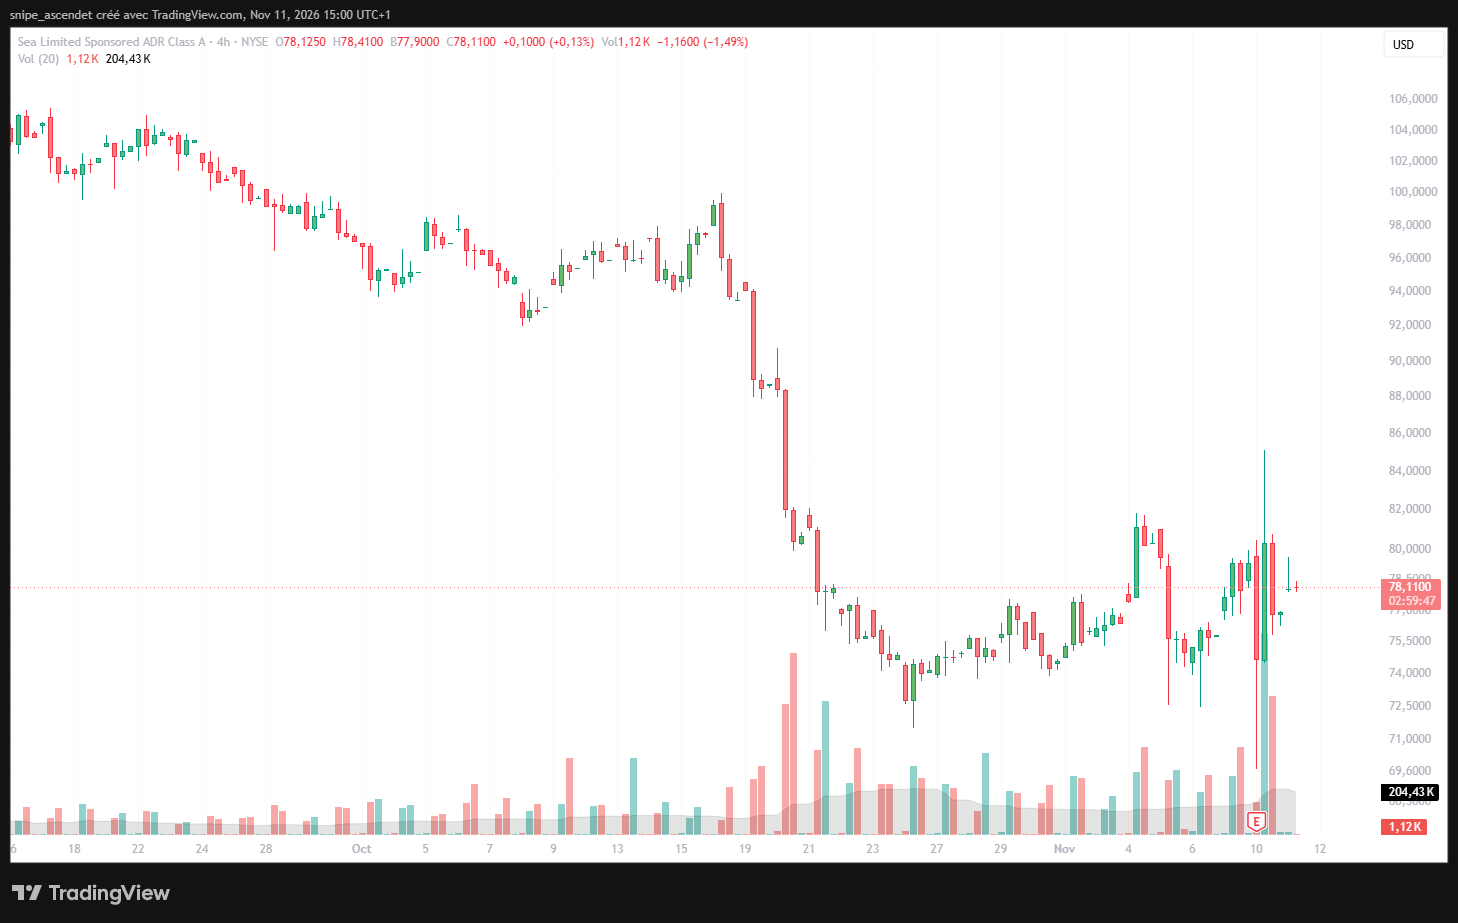
The four-hour chart shows a pronounced October selloff followed by choppy trading around the mid-$70s to low-$80s in early November. On this display, approximately $72–$75 is a recent trading area to monitor, while approximately $80–$85 has seen trading resistance. These are visual, approximate zones rather than confirmed future support or resistance levels. Earnings volatility can invalidate them quickly.
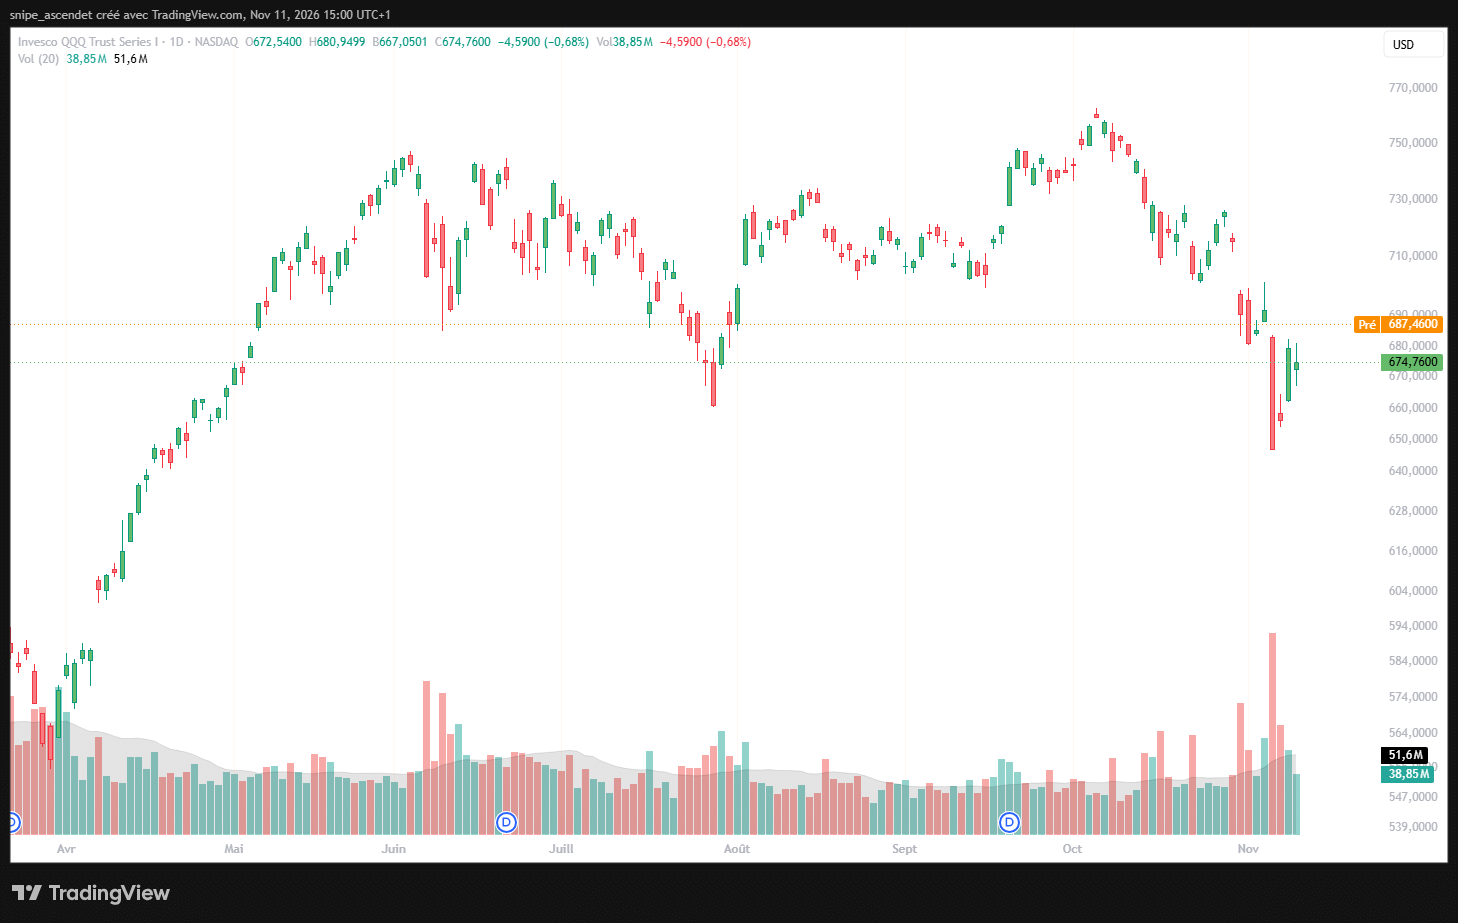
There was also broader market weakness. The QQQ daily chart provided for November 10 shows a 0.68% decline, compared with SE’s 1.49% decline at the close. The difference was approximately 0.81 percentage points that day. This indicates relative underperformance during that session, but one session cannot separate earnings-specific trading from market, sector and positioning effects.
Is SE Stock Cheap After the Decline? Five Things to Check
A lower share price does not automatically imply a bargain. A valuation must incorporate future profitability, the credit cycle, spending needs, expected dilution, and the price investors pay for those outcomes. When evaluating Sea, an investor should test the following variables rather than extrapolate 43.4% quarterly revenue growth indefinitely:
- Shopee unit economics: Can core marketplace monetization grow faster than logistics, promotions and customer-acquisition expense?
- Monee credit quality: Do the 90-day delinquency ratio and credit-loss provisions stabilize as the loan portfolio matures?
- Garena durability: Do bookings, active users and paying-user conversion support earnings beyond accounting timing effects?
- Cash and capital allocation: How much cash is unrestricted, what funds loan growth, and when are buybacks actually executed?
- Valuation discipline: What operating margins, reinvestment levels and discount rates are needed to justify the current equity value?
A discounted cash flow analysis can help organize those assumptions, but a single-point target price would be premature without a complete, internally consistent forecast. Our Zeta Global earnings and valuation analysis offers another example of why reported growth must be assessed against profitability, cash flow and the price investors pay. In an integrated commerce-and-lending model, it is particularly important not to double-count financial assets, credit provisions, and cash flows.
Bottom Line: Growth Was Strong, but Earnings Quality Matters
Sea’s Q3 2026 earnings showed strong demand and monetization across Shopee, Monee and Garena. They also showed why the stock market can mark down a company after a revenue beat: the $0.78 diluted EPS result fell short of one widely cited $0.99 consensus, credit provisions and marketing costs grew faster than sales, and operating and net margins narrowed despite an improvement in gross margin.
The November 10 close of $76.80, down 1.49%, was much less severe than the roughly 8.9% premarket decline reported earlier that day, although trading volume was elevated. For a long-term investor, the next evidence to watch is not the size of one daily price move. It is whether Shopee’s monetization, Monee’s loan losses and Sea’s cash deployment produce stronger sustainable profit per share. This analysis is educational, not personalized investment advice; market prices and forecasts can change.